Figures & data
Table 1. Secondary metabolites detected in olive root extracts by LC-ESI-QTOF MS.
Table 2. Basal composition of metabolites scored for control (non-inoculated) olive plant roots.
Figure 1. Hierarchical clustering heatmap showing the quantitative basal metabolites composition present in roots of control (non-inoculated) olive plants at different sampling time points (t0, 1, 2, 7, 15 days). The concentration of each compound is the average value of three replicates (n = 3) per variety.
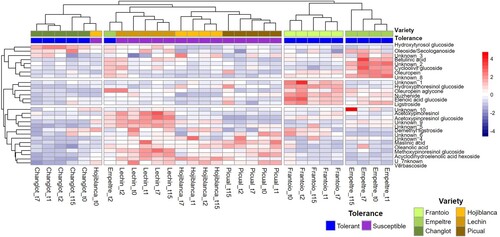
Figure 2. Time course variation in the concentration of nuzhenide (A), unknown_3 (B), oleanolic acid (C), and unknown_5 (D). Green and ocher bars represent VWO-tolerant and VWO susceptible control (non-inoculated) plants, respectively, while black bars correspond to Verticillium dahliae-inoculated plants. Error bars show the standard deviation of three biological replicates (n = 3). Lowercase letters indicate Tukey’s post hoc test differences (p < 0.05) among control (black) and inoculated (red) plants. Statistical differences resulting from the ANOVA analysis between the control and inoculated plants are represented by asterisks (level of significance p < 0.05). DAI, days after inoculation.
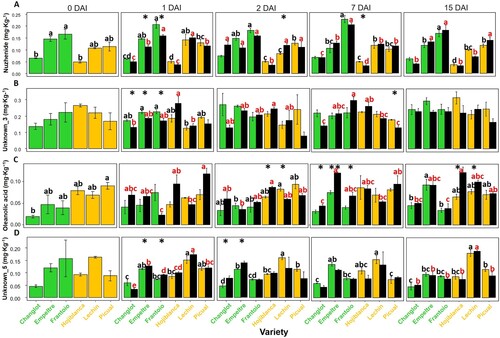
Figure 3. Time course variation in the concentration of unknown_7 (A), oleoside/secologanoside (B), unknown_2 (C), unknown_8 (D), and unknown_9 (E). Green and ocher bars represent VWO-tolerant and VWO susceptible control (non-inoculated) plants, respectively, while black bars correspond to Verticillium dahliae-inoculated plants. Error bars show the standard deviation of three biological replicates (n = 3). Lower case letters indicate Tukey’s post hoc test differences (p < 0.05) among control (black) and inoculated (red) plants. Statistical differences resulting from the ANOVA analysis between the control and inoculated plants are represented by asterisks (level of significance p < 0.05). DAI, days after inoculation.
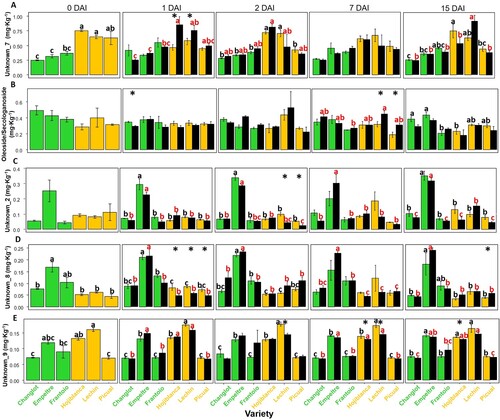
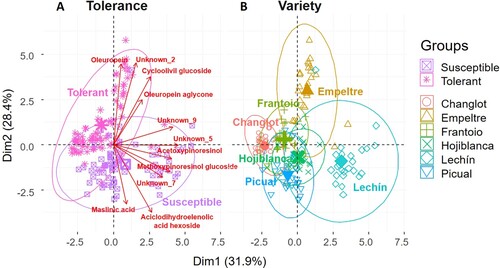
Figure 4. Principal Component Analysis (PCA) of olive root metabolites performed with ‘tolerance’ and ‘variety’ as factors. Compounds with a contribution to the two dimensions higher than 4% were considered for the analysis. Verbascoside, acetoxypinoresinol glucoside, ligstroside, and unknown_8 were not considered because they were highly correlated with other metabolites that had a higher percentage of explanation (acyclodihydroelenolic acid hexoside, unknown_5, and oleuropein).