
Figures & data
Figure 1. Phenotype assessment of salt tolerance in rice plants. The phenotype of rice plants from all the treatment groups: unstressed control (CN); weekly biostimulant treatment under non-stress condition (N+W); biweekly biostimulant treatment under non-stress condition (N+B); salt stress (200 mM NaCl) control (CS); salt-stressed plants with weekly biostimulant treatment (S+W); and salt-stressed plants with biweekly biostimulant treatment (S+B).
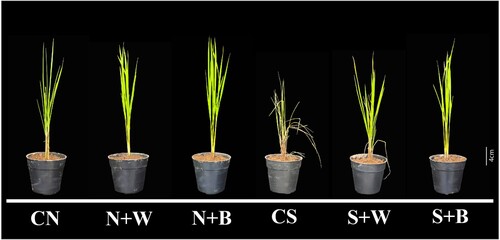
Table 1. Evaluation of AN-biostimulant treatments on the shoot and root biomass under non-stress and salinity stress conditions.
Table 2. Evaluation of AN-biostimulant treatments on the mineral nutrient contents in rice plants duringnon-stress and salinity stress conditions.
Figure 2. Quantification of the pigment contents in control and AN-biostimulant treated plants under the non-stress and salinity stress conditions. The contents of (A) chlorophyll a (Chl-a), (B) chlorophyll b (Chl-b), (C) total chlorophyll (TChl), and (D) carotenoid (Caro). Data presented are the means ± SE (n = 4) and the significant difference between the means calculated at p ≤ 0.05 using the LSD test.
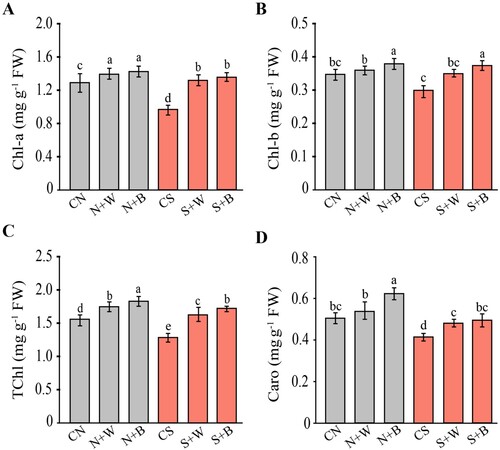
Figure 3. Evaluation of the photosynthetic parameters in control and AN-biostimulant treated plants under the non-stress and salinity stress conditions. (A) Net photosynthetic rate (Pn), (B) transpiration rate (Tr), (C) Intercellular CO2 (Ci), (D) stomatal conductance (Gs), (E) maximum efficiency of photosystem II (Fv/Fm), and (F) Water use efficiency (WUE). Data presented are the means ± SE (n = 4) and the significant difference between the means calculated at p ≤ 0.05 using the LSD test.
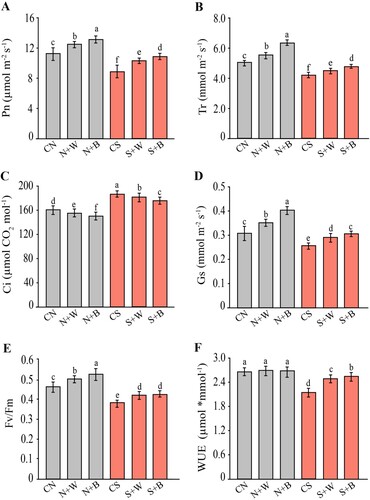
Figure 4. Evaluation of oxidative stress indicators in control and AN-biostimulant treated plants under the non-stress and salinity stress conditions. The measurement of (A) hydrogen peroxide (H2O2), (B) superoxide anion (O2•−), (C) lipid peroxidation (MDA, malondialdehyde), and (D) lipoxygenase activity (LOX) in rice plants Data presented are the means ± SE (n = 4) and significant difference between the means calculated at p ≤ 0.05 using the LSD test.
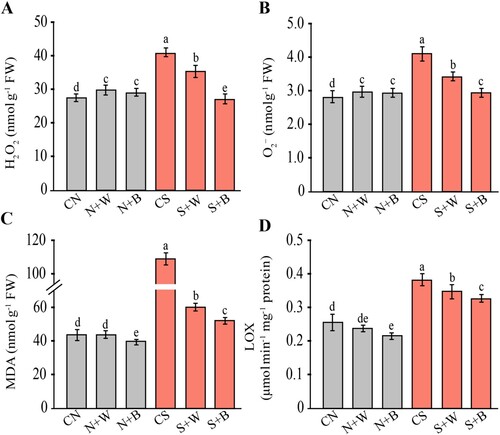
Figure 5. Evaluation of the antioxidant enzymes and related transcripts in control and AN-biostimulant treated plants under the non-stress and salinity stress conditions. The measurement of (A) superoxide dismutase (SOD) activity (B) catalase (CAT) activity, (C) gene expression of OsSOD1, OsSOD2, OsSOD3, and (D) gene expression of OsCATa, OsCATb, and OsCATc. Data presented are the means ± SE (n = 4) and the significant difference between the means calculated at p ≤ 0.05 using the LSD test. The heatmap has been generated based on the fold-change values in the treated sample when compared with the unstressed control. The color scale for fold-change values is given on the left panel.
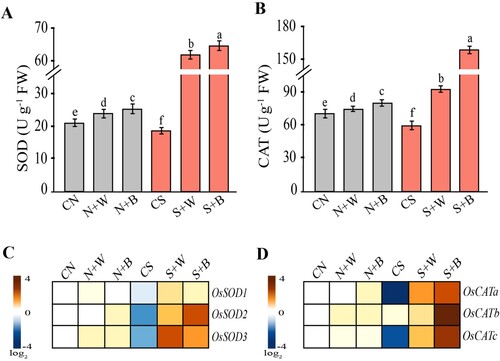
Figure 6. Differential metabolites profile in control and AN-biostimulant treated rice plants under the non-stress and salinity stress conditions. The differential profile of 66 key metabolites (organic acids, sugars, amino acids, and others) are presented as heatmap. The heatmap shows the log2 fold change ratios and the purple color codes representing increase in metabolites, whereas the yellow color codes show decrease of metabolites. The data is representative of three independent experiments.
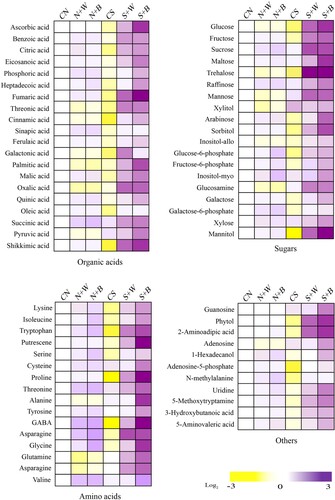
Figure 7. Box plots showing the relative abundance of selected metabolites (organic acids, sugars, and amino acids) that show significant variation in control and AN-biostimulant treated plants under non-stress and salinity stress conditions.
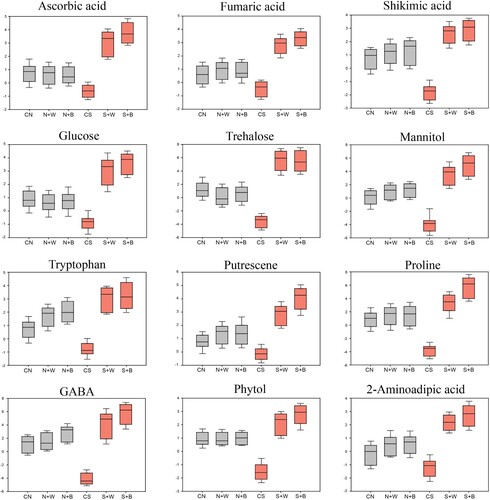
Figure 8. Gene expression analysis of the flavonoid structural genes in control and AN-biostimulant treated rice plants under the non-stress and salinity stress conditions. (A) The flavonoid biosynthesis branch of the phenylpropanoid pathway. The transcripts of flavonoid structural genes highlighted with bold text have been confirmed in this study. (B) Heatmap analysis of the eight core flavonoids structural genes viz. PAL, C4H, 4CL, CHS, CHS, CHI, DFR, and ANS. (C) The total flavonoids (TFlav) content in control and treatment groups. The data is representative of three independent experiments. Data presented are the means ± SE (n = 4) and the significant difference between the means calculated at p ≤ 0.05 using the LSD test.
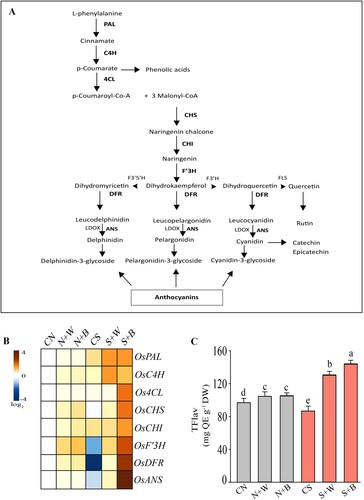
Figure 9. Pearson’s correlation analysis for all parameters of growth and physiology, antioxidant enzymes, and other selected biochemical markers (trehalose, mannitol, proline, and γ-aminobutyric acid) under non-stress condition. SL: shoot length; SFW: shoot fresh weight; SDW: shoot dry weight; RL: root length; RFW: root fresh weight; RDW: root dry weight; RWC: relative water content; K+: potassium; Na+: sodium; Mg2+: magnesium; Ca2+: calcium; K+/Na+: ratio of K+ and Na+; Chl-a: chlorophyll a; Chl-b: chlorophyll b; TChl: total chlorophyll; Caro: carotenoids; Pn: Net photosynthetic rate; Tr: transpiration rate; Ci: intercellular CO2; Gs: stomatal conductance; Fv/Fm: maximum efficiency of photosystem II; WUE: water use efficiency; H2O2: hydrogen peroxide; O2•−: superoxide anion; MDA: malondialdehyde; LOX: lipoxygenase activity; SOD: superoxide dismutase; CAT: catalase; TFlav: total flavonoids; Pro: proline; Tre: trehalose; Mann: mannitol; and GABA: γ-aminobutyric acid.
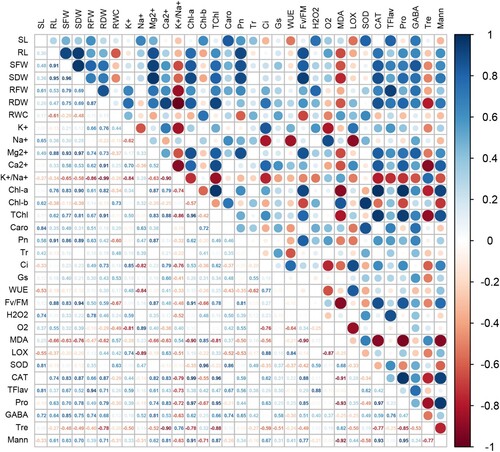
Figure 10. Pearson’s correlation analysis for all parameters of growth and physiology, antioxidant enzymes, and other selected biochemical markers (trehalose, mannitol, proline, and γ-aminobutyric acid) under the salt-stress condition. See details of parameters in figure 9.
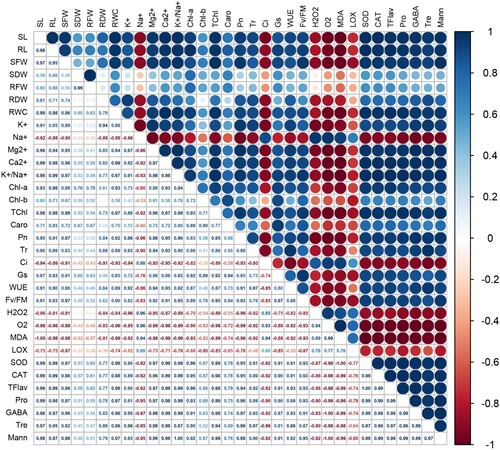
Figure 11. Principal component analysis (PCA) for all parameters of growth and physiology, antioxidant enzymes, and other selected biochemical markers (trehalose, mannitol, proline, and γ-aminobutyric acid) in the treatment groups. See details of parameters in figure 9.
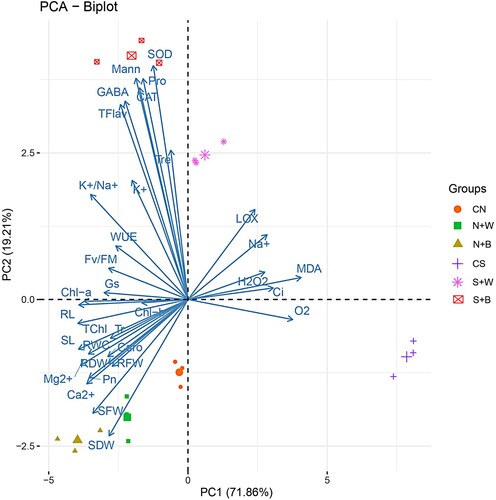
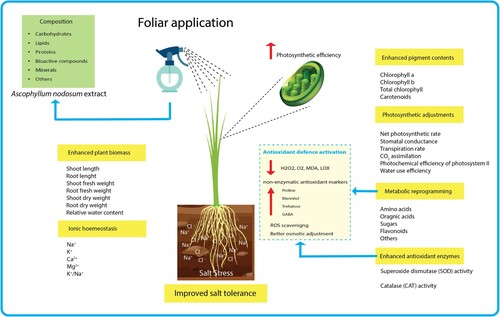
Figure 12. The schematic model depicting the role of foliar treatment of Ascophyllum nodosum biostimulant in improving salt tolerance of rice: Application of biostimulant improved rice salt tolerance by several physiological, molecular, and cellular responses that include: increased photosynthetic pigments, photosynthetic activity and efficiency, plant biomass, water use efficiency, ionic homeostasis, as well as enzymatic and non-enzymatic antioxidant potential.
Supplemental Material
Download MS Word (31.6 KB)Supplemental Material
Download MS Word (3.1 MB)Data availability statement
The original contributions presented in this study are included in the article/supplementary material, further inquiries can be directed to the corresponding author.