Figures & data
Table 1. List of samples tested, and summary of the evidence, based on traditional barcoding techniques, regarding the correct species for all the specimens used in the study.
Table 2. Candidate barcode targets and primers selected for the study. The table shows the size of the predicted amplicon. The gene targeted by each barcode was determined by the annotation of the region in the G. morhua genome.
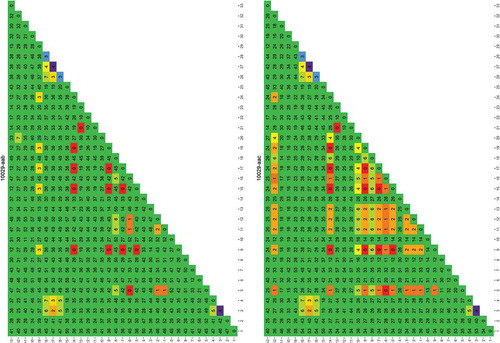
Figure 1. Rapid evaluation of the usefulness of a genomic region targeted by primer 4049-aab to distinguish one species from another.
The species used for this analysis were those for which a genome was publicly available. Each column/row shows the number of differences found between the species numbered 1–33 (between species variability, the larger the more useful the sequence is in distinguishing species). The diagonal shows the differences found between the different sequence versions of that species (within species variability, the larger the more difficult it is to uniquely identify the species). The results are colour coded red to green in the main matrix body (green = high between species variability) and purple to green on the diagonal (green = low within species variability). List of species: 1) Cynoglossus semilaevis; 2) Cyprinodon variegatus; 3) Cyprinus carpio; 4) Danio rerio; 5) Dicentrarchus labrax; 6) Gadus macrocephalus; 7) Gadus morhua; 8) Gasterosteus aculeatus; 9) Haplochromis burtoni; 10) Kryptolebias marmoratus; 11) Labrus bergylta; 12) Larimichthys crocea; 13) Lates calcarifer; 14) Lepisosteus oculatus; 15) Maylandia zebra; 16) Miichthys miiuy; 17) Neolamprologus brichardi; 18) Notothenia coriiceps; 19) Oreochromis niloticus; 20) Oryzias latipes; 21) Poecilia Formosa; 22) Poecilia latipinna; 23) Poecilia mexicana; 24) Pundamilia nyererei; 25) Pygocentrus nattereri; 26) Sinocyclocheilus anshuiensis; 27) Sinocyclocheilus graham; 28) Sinocyclocheilus rhinocerous; 29) Stegastes partitus; 30) Takifugu rubripes; 31) Tetraodon nigroviridis; 32) Thunnus orientalis; 33) Xiphophorus maculatus.
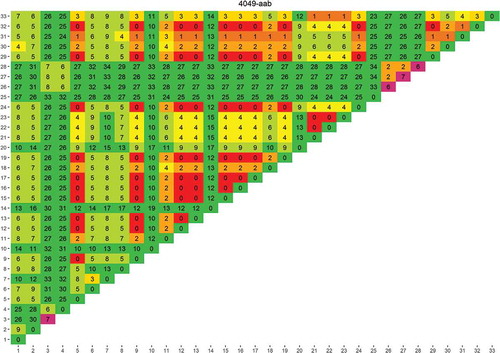
Table 3. Tested primers on different samples from different species. Each primer has been tested on DNA from different samples. In case of more than one sample per species, all of them have been tested and sequenced. In cases where no PCR product was obtained (T-X), the main reason was a low PCR yield. Legend: T = PCR tested; A = amplicon present; S = amplicon sequenced; X = amplicon not present/amplicon not sequenced; – = PCR not tested.
Figure 2. Alignment of sequences amplified by using primer pair 4049-aab.
The alignment of sequences amplified by using primer pair 4049-aab is shown. Each sequence represents one of the following species: Gadus chalcogrammus (Gcha), G. macrocephalus (Gmac), G. morhua (Gmor), Merluccius merluccius (Mmer), M. paradoxus (Mpar), M. Merlangus (Mmel), P. virens (Pvir) and P. pollachius (Ppol). As highlighted by colours, there are six different base positions on this locus that, taken all together into account, could be used to distinguish Merluccius genus (in red) from the others (in green).
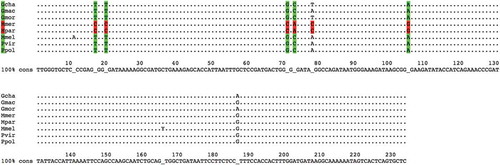
Figure 3. Alignment of sequences amplified by using primer pair 2034-aac.
The alignment of sequences amplified by using primer pair 2034-aac is shown. Each sequence represents one of the following species: Gadus chalcogrammus (Gcha), G. macrocephalus (Gmac), G. morhua (Gmor), Merluccius merluccius (Mmer), M. paradoxus (Mpar), M. Merlangus (Mmel), P. virens (Pvir) and P. pollachius (Ppol). As highlighted by colours, there are seven different base positions on this locus that, taken all together into account, can be used to distinguish the Merluccius genus (in red) from the others (in green). In addition to that, Gadus morhua has a peculiar insertion of 12 bases (highlighted in blue). Bases in lowercase indicate those bases that, among the different samples tested in one species, are not always present.
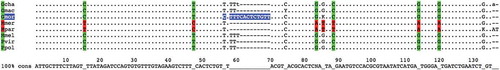
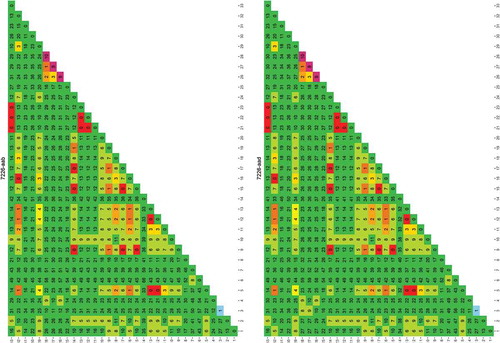
Figure 4. Alignment of sequences amplified by using primer pair 7226-aad.
The alignment of sequences amplified by using primer pair 7226-aad is shown. Each sequence represents one of the following species: Gadus chalcogrammus (Gcha), G. macrocephalus (Gmac), G. morhua (Gmor), Merluccius merluccius (Mmer), M. paradoxus (Mpar), M. Merlangus (Mmel), P. virens (Pvir) and P. pollachius (Ppol). Primer pair 7226-aad produces genera-specific amplicons in terms of length. Moreover, as highlighted by colours, there are different single base positions on this locus that, taken all together into account, can be used to distinguish Merluccius genus (in red) from the others (in green); in particular, Gadus morhua has two peculiar variations (highlighted in blue).
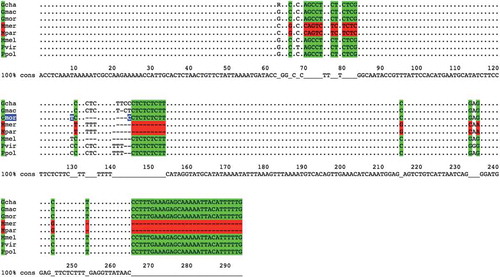
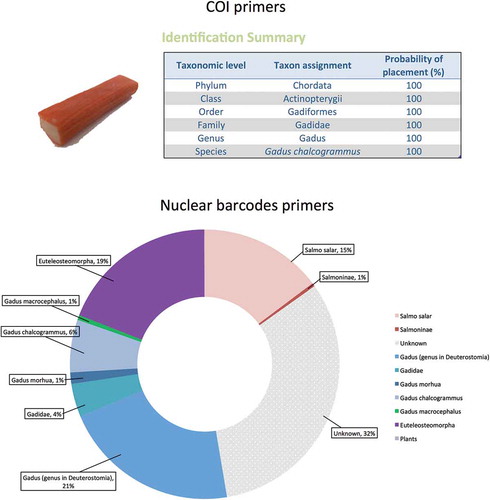
Figure 5. Analysis of complex, processed fish samplesA ‘Smoked salmon surimi’ product from the supermarket was analysed. Upper part: the traditional COI barcode, coupled to Sanger sequencing, produced a single sequence that was classified as ‘Gadus chalcogrammus’ by the BOLD systems identification portal (Ratnasingham and Hebert Citation2007). Lower part: the NGS analysis, in contrast, also detected the minority salmon fraction of the fish flesh. The picture represents a pool of the results obtained for all the nuclear barcode primers analysed (2034-aac, 4049-aab, 3726-aad, 3726-aab, 7226-aad, 7226-aaf, 10,029-aab, 10,029-aac).