
Figures & data
Table 1. Identification of Staphylococci Isolates by MALDI-TOF MS.
Tabla 1. Identificación de los aislados de estafilococos mediante EM MALDI-TOF
Figure 1. (a) Comparison of MALDI-TOF MS representative spectra of randomly selected nine Staphylococci (b) Close examination of protein peaks common to these nine Staphylococci (c) Similarity graph to standard strain S. aureus ATCC 25923 THL (SA-18) according to CCI values of all protein profiles of seventeen other Staphylococci defined by MALDI-TOF MS.
Figura 1. (a) Comparación de los espectros representativos de la EM MALDI-TOF de nueve estafilococos seleccionados aleatoriamente; (b) examen minucioso de los picos de proteínas comunes a los nueve estafilococos; (c) gráfico de similitud con la cepa estándar S. aureus ATCC 25923 THL (SA-18), según los valores de CCI de todos los perfiles de proteínas de otros 17 estafilococos definidos por EM MALDI-TOF
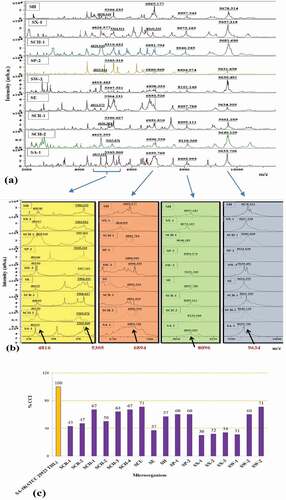
Figure 2. (a) Representative whole-cell MALDI-TOF MS spectra of randomly selected six S. aureus and the standard strain S. aureus ATCC 25923 THL (SA-18). X and Y axes represent m/z and intensity, respectively. (b) Spectral gel images of twenty-seven S. aureus and SA-18 show continuous projection of all biomarker proteins (m/z; 4316, 4816, 5526, 6895 and 9636). X and Y axes represent m/z and spectra of S. aureus, respectively.
Figura 2. (a) Espectros de EM MALDI-TOF representativos de células enteras de seis S. aureus seleccionados aleatoriamente y de la cepa estándar S. aureus ATCC 25923 THL (SA-18). Los ejes X e Y representan m/z e intensidad, respectivamente; (b) imágenes espectrales de gel de 27 S. aureus y SA-18 muestran la proyección continua de todas las proteínas biomarcadoras (m/z; 4316, 4816, 5526, 6895 y 9636). Los ejes X e Y representan m/z y espectros de S. aureus, respectivamente
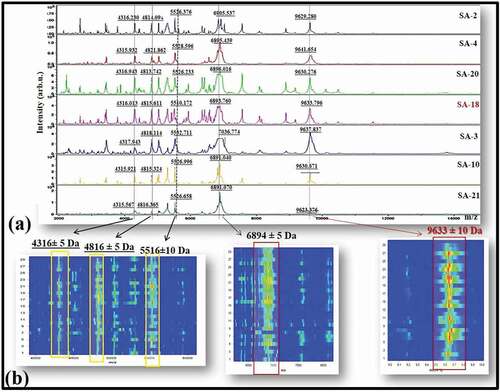
Figure 3. (a) The dendrogram profile and (b) 3D scatter profile of all forty-four Staphylococci with the standard strain S. aureus ATCC 25923 THL (SA-18). The spot represents one spectrum, and the plots were generated by PCA. List of other Staphylococci matched with dendrogram numbers. (c) The explanation of variance of all forty-four Staphylococci.
Figura 3. (a) Perfil del dendrograma; y (b) perfil de dispersión 3D de los 44 estafilococos de la cepa estándar S. aureus ATCC 25923 THL (SA-18). El punto representa un espectro y los gráficos se generaron mediante PCA. La lista de otros estafilococos coincide con los números del dendrograma; (c) explicación de la varianza de los 44 estafilococos
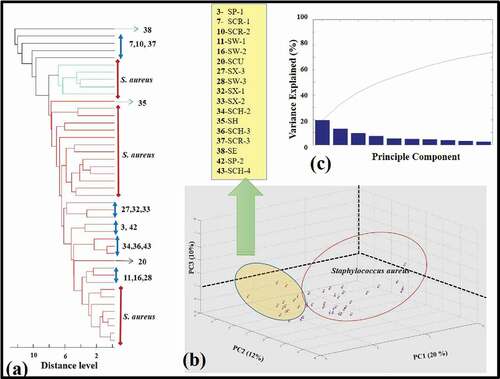
Figure 4. Biotyper analysis of twenty-seven S. aureus and standard strain S. aureus ATCC 25923 THL (SA-18). (a) The first three variance values on their dendrogram profile. (b) Their 3D scatter profile. The spot represents one spectrum, and the plots were generated by PCA.
Figura 4. Análisis de biotipos de 27 S. aureus y de la cepa estándar S. aureus ATCC 25923 THL (SA-18). (a) res primeros valores de varianza en su perfil de dendrograma. (b) Su perfil de dispersión en 3D. El punto representa un espectro y los gráficos se generaron mediante PCA
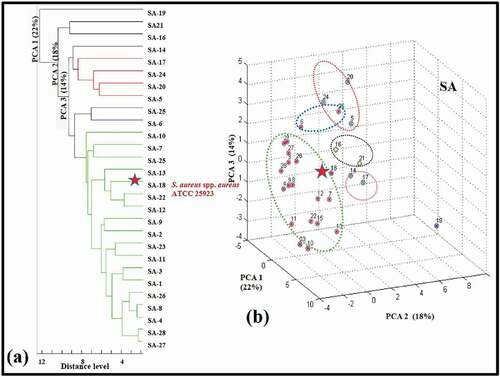
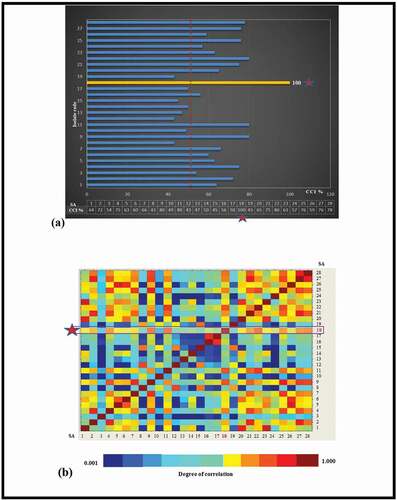
Figure 5. (a) CCI values of the twenty-seven S. aureus according to the standard strain of S. aureus ATCC 25923 (SA-18). (b) The degree of similarity between pair mass spectra comparisons ranging from red (very similar) to blue (very dissimilar).
Figura 5. (a) Valores de CCI de los 27 S. aureus según la cepa estándar de S. aureus ATCC 25923 (SA-18); (b) grado de similitud entre las comparaciones de los espectros de masas de los pares, que van del rojo (muy similar) al azul (muy diferente)
Data availability
The authors confirm that the data supporting the findings of this study are available within the article.