
Abstract
Cruciferous vegetables and oilseeds are rich in glucosinolates that can transform into isothiocyanates upon enzymic hydrolysis during post-harvest handling, food preparation and/or digestion. Vegetables contain glucosinolates that have beneficial bioactivities, while glucosinolates in oilseeds might have anti-nutritional properties. It is therefore important to monitor and assess glucosinolates and isothiocyanates content through the food value chain as well as for optimized crop production. Vibrational spectroscopy methods, such as infrared (IR) spectroscopy, are used as a nondestructive, rapid and low-cost alternative to the current and common costly, destructive, and time-consuming techniques. This systematic review discusses and evaluates the recent literature available on the use of IR spectroscopy to determine glucosinolates and isothiocyanates in vegetables and oilseeds. NIR spectroscopy was used to predict glucosinolates in broccoli, kale, rocket, cabbage, Brussels sprouts, brown mustard, rapeseed, pennycress, and a combination of Brassicaceae family seeds. Only one study reported the use of NIR spectroscopy to predict broccoli isothiocyanates. The major limitations of these studies were the absence of the critical evaluation of errors associated with the reference method used to develop the calibration models and the lack of interpretation of loadings or regression coefficients used to predict glucosinolates.
1. Introduction
Cruciferous vegetables, including the Brassicaceae, Capparaceae, and Caricaceae families, such as broccoli, Brussels sprouts, rocket, cabbage, bok choy, cauliflower, kale, and radish contain high levels of glucosinolates (Connolly et al. Citation2021; Miao et al. Citation2021). Glucosinolates have been reported for having significant antioxidant (Cabello-Hurtado, Gicquel, and Esnault Citation2012), anti-inflammatory (Ruiz-Alcaraz et al. Citation2022), and anticancer (Cuellar-Núñez et al. Citation2020) activities. These compounds have also been reported for their positive effects in treating cardiometabolic (Esteve Citation2020; Chen et al. Citation2018) and musculoskeletal disorders (Connolly et al. Citation2021; Blekkenhorst et al. Citation2017), and more recently in the immune response to SARS-COV-2 based on in vitro findings (Bahoosh, Shokoohinia, and Eftekhari Citation2022).
Glucosinolates are phytochemicals and secondary sulfur compounds that are synthesized from glucose and amino acids (). Glucosinolates comprise a β-D-thioglucoside group and an N-hydroximinosulphate ester with a varying side chain (Aghajanzadeh et al. Citation2018). These compounds can be classified as aliphatic, indolic or aromatic based on the precursor amino acid (methionine, tryptophan, or an aromatic amino acid respectively) (Supplementary File, Figure A) (Halkier and Gershenzon Citation2006; Aghajanzadeh, Prajapati, and Burow Citation2020). Some of the key glucosinolates are progoitrin, sinigrin, glucoraphanin, gluconapin, 4-hydroxyglucobrassicin, glucobrassicin, 4-methoxyglucobrassicin, and neoglucobrassicin (Zhou et al. Citation2022).
Figure 1. General structure of glucosinolates and isothiocyanates and their conversion. The R group is a varying aglycone amino acid-deriving side chain. Glucosinolates can be classified as aliphatic, indolic or aromatic glucosinolates based on the R group.
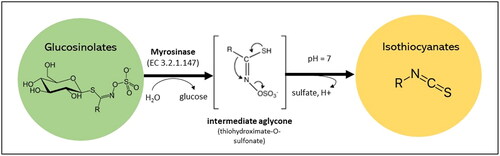
Glucosinolates are considered relatively stable compounds but can undergo hydrolysis to isothiocyanates once the plant tissue is damaged during food processing, preparation, storage or chewing due to the release of a β-thioglucosidase enzyme called myrosinase (Barba et al. Citation2016). These compounds might be also broken down in the human gut by plant and bacterial myrosinases to yield isothiocyanates (Narbad and Rossiter Citation2018).
Isothiocyanates are organic compounds with an isocyanate group in which oxygen is substituted by a sulfur atom to give a functional group of –N=C=S (). The most significant isothiocyanates are sulforaphane and indole-3-carbinol which are derived from glucoraphanin and glucobrassicin, respectively. Sulforaphane has shown remarkable antioxidant (Akbari and Namazian Citation2020), anticancer (Kiani et al. Citation2018), anti-inflammation, antineoplastic, and anti-allergic potentials (Shahrajabian, Sun, and Cheng Citation2019). Indole-3-carbinol has been reported for its anti-inflammatory (Mohammadi et al. Citation2018), anticancer (Karimabad et al. Citation2019), antileukemic (Mohammadi et al. Citation2017; Safa et al. Citation2017), antioxidant, antihypertensive, antiarrhythmic (Prado et al. Citation2022), and wound healing potentials (Eghbalpour et al. Citation2020). Yet, high levels of some isothiocyanates derived from glucosinolates can be anti-nutritive such as goitrin (derived from progoitrin) that can interfere with iodine uptake (Chartoumpekis et al. Citation2019).
Post-harvest and food processing conditions of these vegetables (e.g. storage time, temperature, type of packaging, as well as other treatments) can influence the concentration and bioavailability of glucosinolates, and thus isothiocyanate content (Barba et al. Citation2016). Monitoring the quantities of glucosinolates and isothiocyanates during different stages of food processing is therefore important to inform not only about the optimal processing conditions but also about the availability of these compounds in the end product in order to predict their potential health and nutritional benefits.
The structure of the side chain is highly important in determining the stability of glucosinolates (Barba et al. Citation2016). Glucosinolates that are structurally similar, such as the alkenyl glucosinolates gluconapin and sinigrin or sulfinyl glucosinolates glucoraphanin and glucoiberin (differing with each other by a single CH2 group in their side chain), are highly correlated in their degradation (Hennig et al. Citation2013). Indole glucosinolates (e.g., 4-methoxyglucobrassicin, 4-hydroxyglucobrassicin, neoglucobrassicin, and glucobrassicin) are more sensitive to post-harvest conditions than aliphatic glucosinolates (e.g., sinigrin, glucoraphanin, glucoiberin, and glucoerucin) (Oerlemans et al. Citation2006). Throughout the storage of vegetables, glucosinolates are relatively stable, with total glucosinolate content reducing only by 11–27% after 7 days of storage at 4–8 °C (Song and Thornalley Citation2007).
It has been reported that regardless of the compound species, a substantial amount of glucosinolates can be lost through leaching into surrounding water when Brassica vegetables are boiled or steamed. This reaction can be exacerbated by higher temperatures and longer processing times (Oliviero, Verkerk, and Dekker Citation2018). However, the stability of individual glucosinolates varies depending on the plant species or vegetable, due to differences in myrosinase activity, innate stress responses, diffusivity of the compounds, pH, and cellular composition (Luo et al. Citation2022; Sarvan et al. Citation2014).
Unless the vegetable or plant part is blanched to denature degradative enzymes, mechanical forces applied during food processing will likely result in cell rupture, releasing myrosinase and resulting in the enzymatic degradation of glucosinolates (Barba et al. Citation2016). This interaction facilitates the production of the desired isothiocyanates or other products, such as, nitriles, epithionitriles, thiocyanates, or indoles depending on the pH and presence of specific proteins (Oliviero, Verkerk, and Dekker Citation2018). The initial stage of the reaction between the glucosinolate and myrosinase is the formation of an unstable thiohydroximate-O-sulphate aglycone (Barba et al. Citation2016). The presence of epithiospecifier (ESP), thiocyanate-forming, or nitrile-specifier proteins can favor the conversion of the aglycone to nitriles, epithionitriles or thiocyanates (Oliviero, Verkerk, and Dekker Citation2018). However, at neutral or slightly alkaline pH, with ESP inactivated, isothiocyanate production is increased. Allyl, benzyl, and phenethyl isothiocyanates are produced from the glucosinolate precursors sinigrin, glucotropaeolin, and gluconasturtiin respectively, along with sulforaphane from glucoraphanin. Unlike the stability of glucosinolates in the whole plant, isothiocyanates are less stable and have been shown to be particularly temperature labile, degrading rapidly at temperatures over 60 °C (Van Eylen et al. Citation2007). Therefore, moderate food processing that would inactivate ESP, but not myrosinase, would likely generate the greatest quantity of bioavailable isothiocyanates.
In addition to cruciferous plants, oilseeds are also a rich source of glucosinolates (Wang et al. Citation2019; Chen et al. Citation2019). The concentration and profile of glucosinolates have been considered an important trait to be included in breeding programs of these species (Tan et al. Citation2022). Although conserving high levels of glucosinolates in vegetables is significant due to their health-promoting benefits, the a high level of glucosinolates in oilseeds is not favorable (Yang et al. Citation2021). From a nutritional perspective, it is more desirable for oilseeds to contain high levels of polyunsaturated fatty acids and low levels of erucic acid and glucosinolates. Glucoraphanin and glucobrassicin, which are known for their health promoting benefits, are either absent or present in very low concentrations in oilseeds (Yasumoto et al. Citation2010). Instead, oilseeds contain aliphatic glucosinolates (e.g. progoitrin and sinigrin) that are considered anti-nutritive and decrease the quality of oilseeds (Nambiar et al. Citation2021). Thus, levels of glucosinolates in oilseeds need to be monitored. Seeds are assessed for quality to optimize the value of crop production (Dolatparast et al. Citation2021). This helps the agriculture sector determine the best quality for planting, identify any problems associated with seed quality, optimize the drying processes, and ensure that the seed quality meets standards and labeling specifications (Pedrini and Dixon Citation2020; ElMasry et al. Citation2019).
The most common analytical techniques utilized for the determination and quantification of these compounds are chromatographic and/or hyphenated spectrometry techniques including high-pressure liquid chromatography (HPLC) (Theunis et al. Citation2022), liquid chromatography–mass spectrometry (LC-MS) (Wu et al. Citation2021), and gas chromatography–mass spectrometry (GC-MS) (Zeng et al. Citation2021). These analytical techniques provide direct and accurate quantification of the different phytochemicals in the sample matrix after extraction and dilution (Hooshmand and Fomsgaard Citation2021) provided pure standards are available. However, these methods are destructive, require different sample preparation steps (e.g. grinding, extraction), high volumes of solvents, are time-consuming and expensive and thus not suitable for large scale analysis. On the other hand, vibrational spectroscpy (e.g. infrared (IR) and Raman) techiques are relatively quick, inexpensive, nondestructive, and do not require complex sample preparation or solvents, making it attractive for large-scale analysis and industry conditions (Zare, Zandi Esfahan, and Ghorbani Citation2019). These techniques could be applied and implemented for in field (e.g. farm), on site (e.g. factory), and/or processing analysis and monitoring. Vibrational spectrosocpy techniques have been used in food sciences and analytical chemistry as techniques to measure the proximate composition of foods and agricultural products (e.g. protein, fat, moisture), and more recently to predict levels of specific biaoctive molecules such as phenolics and volatile compounds in several food matrices (Su and Sun Citation2018). In recent years the use of IR spectroscopy has been explored to predict phytochemicals such as glucosinolates in glucosinolate-rich vegetables and oilseeds. However, no studies have been reported on the use of Raman spectroscopy for the determination of glucosinolates or isothiocynates in plants.
In any given application of IR spectroscopy to analyze food ingredients and products (e.g. natural products), challenges associated with the interpretation of the spectra as well as the development of a calibration used to determine the amount of a phytochemical in a given sample can be encountered. The IR spectrum obtained contains complex information related not only with the chemical composition but also with other physicochemical properties of the sample. In addition, data mining techniques and chemometric analysis are required to interpret the spectra and to develop a calibration model (Parrini et al. Citation2019; Haghi, Pérez-Fernández, and Robertson Citation2021).
This systematic review aims to provide researchers in the field with the current and latest developments in determination of glucosinolates and isothiocyanates using IR spectroscopy. In addition, it provides an overview of calibration development, key wavelengths, limitations on the use of IR, and practical considerations in using this technique to determine glucosinolates and isothiocyanates.
2. Systematic review search methodology
This systematic review focuses on IR spectroscopy methods that have been used to determine the glucosinolate and isothiocyanate content in different natural sources (e.g. vegetables and oilseeds). The search strategy was based on three main concepts. Concept 1 focuses on the type of bioactive compounds: glucosinolates and isothiocyanates, concept 2 considers the use of IR spectroscopy as the analytical technique for method development, and concept 3 examines the goal of the analytical method that must be quantitative. The search was conducted using three different databases (Scopus, PubMed, and Web of Science) using a search strategy considering (glucosinolate* OR isothiocyanate* OR glucobrassicin OR glucocapparin OR glucoraphanin OR gluconasturtiin OR glucotropaeolin OR progoitrin OR sinigrin OR sinalbin OR sulforaphane OR sulphoraphane OR raphanin OR “allyl isothiocyanate” OR “methyl isothiocyanate” OR “benzyl isothiocyanate” OR “fluorescein isothiocyanate” OR “phenyl isothiocyanate” OR “phenethyl isothiocyanate” OR “6-(methylsulfinyl) hexyl isothiocyanate”) AND (infrared OR “infrared spectroscopy” OR “IR spectroscopy” OR “near infrared” OR “NIR spectroscopy” OR NIR OR “Fourier transform-infrared” OR FTIR) AND (determine* OR analys* OR predict* OR monitor* OR investing* OR quanti*) as the topic of the research article. Mesh terms (“glucosinolates”[Mesh], “isothiocyanates”[Mesh], and “Spectrophotometry, Infrared”[Mesh]) were also included in the search strategy when using PubMed. Google Scholar was also used for finding research articles manually (no new records were identified). No similar systematic literature reviews were found for reference screening. The original research articles considered were those published between 1st January 2012 and 11th January 2023 and in the English language. The inclusion and exclusion criteria, along with flow chart of the systematic methodology (Figure B), can be found in the Supplementary File.
3. Infrared and chemometrics
The most common IR techniques reported by different authors to analyze glucosinolates and isothiocyanates are near infrared (NIR) spectroscopy, the combination of visible (VIS) and NIR, and the use of attenuated total reflectance (ATR) combined with Fourier transform mid infrared (ATR-FTMIR) spectroscopy. The IR region covers the region between 750 nm and 1 mm of the electromagnetic spectrum (Segneanu et al. Citation2012). The IR region is divided into three ranges namely the near infrared (NIR) region between 750 and 2500 nm; the mid infrared (MIR) region between 4000 and 400 cm−1 (2500–25,000 nm); and the far infrared (FIR) region between 400 and 10 cm−1. In short, IR spectroscopy measures the relationship between light and the molecules present in a sample. NIR spectroscopy is based on the measurement of molecular overtones and a combination of vibrational modes (Bec, Grabska, and Huck Citation2022), while MIR spectroscopy measures the fundamental vibrations that are associated with the functional groups present in the sample that can help in determining the chemical composition and other functional properties of the sample, as well as identify samples using the MIR fingerprint region (Campanella, Palleschi, and Legnaioli Citation2021).
A common initial step after obtaining the IR data is to preprocess the spectra using techniques such as baseline and slope correction, smoothing, normalization, derivatives (first and second), multiplicative scatter correction (MSC), standard normal variate (SNV), and de-trending (Rohman et al. Citation2019). After preprocessing the spectra, the IR data is inspected to visualize trends, patterns, and outliers in the data set. The most commonly used method in this step is principal component analysis (PCA), a method that decreases the dimensionality of the data by introducing two new set of values called scores and loadings (Bro and Smilde Citation2014). This technique is applied to distinguish spectrally similar samples (e.g. trends and patterns), it can be used to select a representative or similar subset of samples without any data loss, as well as in identifying spectral outliers from the raw data (Bro and Smilde Citation2014).
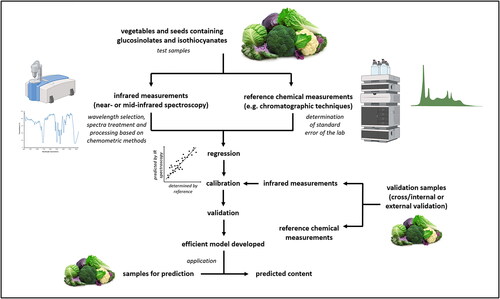
After inspecting the IR spectra, either a quantitative or qualitative method can be developed. To develop a quantitative method or calibration model, a regression analysis is performed using the absorbance at different wavelengths (obtained from IR data) and the reference values obtained from a validated laboratory method (reference method). Different regression methods are used to develop a calibration model, those include partial least squares regression (PLS), modified partial least squares regression (MPLS), principal component regression (PCR), multiple linear regression (MLR) and stepwise multiple linear regression (SML) (Rohman et al. Citation2019). After a calibration model is developed, it needs to be validated (Williams, Dardenne, and Flinn Citation2017). A frequently used validation method during calibration development is cross-validation (internal validation); however, a proper validation method must include an external or independent data set (Williams, Dardenne, and Flinn Citation2017).
Several statistical parameters are used to evaluate the performance of a calibration model (Williams, Dardenne, and Flinn Citation2017). The coefficient of determination (R2) can be used to evaluate the model in terms of the correlation between the reference values and IR predicted values. Models with R2 > 0.90 have excellent correlation, 0.82 < R2 < 0.90 have good correlation, 0.65 < R2 < 0.81 could give estimated predictions, 0.50 < R2 < 0.64 can only be used for qualitative analysis, while 0.26 < R2 < 0.49 have poor correlation (Williams and Norris Citation2001). In addition to the R2, the standard error in cross validation (SECV) and prediction (SEP) are important statistical parameters to assess the error associated with the model. The SECV and SEP are a measure of the precision of prediction and refer to the difference between the repeated measurements of the same target compound (Golic and Walsh Citation2006). The root mean square of the standard errors can also be used for statistical evaluation of models, such as root mean square error of prediction (RMSEP) and root mean standard error of cross-validation (RMSECV) (Williams and Norris Citation2001).
The ratio of the standard deviation of the reference data (SD), to the SECV or SEP, also referred to as the residual prediction deviation (RPD = SD/SECV or SEP), should be included to estimate the prediction ability of the developed calibration model (Williams, Dardenne, and Flinn Citation2017). RPD values can be used to classify and identify the application of the developed model, such that, an RPD value of 0.0–2.3 suggests that the model is very poor and has no practical applications, a model with an RPD value of 2.4–3.0 is poor and can be only used for rough screening (e.g., in breeding programmes), RPD values in the range of 3.1–4.9 suggest that the model is fair and can be used for screening purposes, a good model has an RPD value of 5.0–6.4 and can be used for quality control, very good models are those that have an RPD value of 6.5–8.0 and are efficient for process control, while models with an RPD value higher than 8.1 are excellent and can be used for any application (Williams Citation2014). In addition, the precision and quality thresholds for model performance can be evaluated based on the range error ratio (RER) value which is calculated by determining the ratio of the range of the original data to the SEP or SECV (RER = range/SEP or SECV). An RER value above 15 suggests that the calibration is good for quantification with high precision, a value between 10 and 15 suggests that the calibration is appropriate for quality control, while a value between 4 and 10 suggests that the model is useful for sample screening only (Williams and Norris Citation2001). The bias, slope and number of latent variables or number of components (factors) of the developed model have to be reported as well (Williams, Dardenne, and Flinn Citation2017).
Although the above-mentioned statistical parameters are commonly used in assessing the robustness of a calibration model, yet they are controversies associated with their use. For example, R2 is dependent on the data set range (e.g. concentration of analyte), having a direct effect on the predictive capacity of the calibration model to predict new samples (Fearn Citation2014). Thus, when R2 values from different experiments are compared, it is important to interpret this parameter very carefully, considering among different factors the range in composition of the samples used during the development of the calibration model. This also applies to the interpretation of the RDP value (Fearn Citation2014). One of the controversies associated with the interpretation of the RDP value is related to the fact that this parameter can be easily alter by the inclusion of extreme sample (e.g. very low or high analyte concentration) (Esbensen, Geladi, and Larsen Citation2014).
In addition to the R2 and RPD, other parameters should be considered while assessing the developed models. For example, it is also important to report the standard error of the performed reference method such as the standard error of the laboratory (SEL), or the standard error of the test (SET) (Williams, Dardenne, and Flinn Citation2017). This error should be compared with the SECV and SEP. Additionally, it is helpful to report the limit of detection (LOD) and limit of quantitation (LOQ) of the reference method from the calibration curve. These details provide information about the accuracy and efficiency of the reference method (Williams, Dardenne, and Flinn Citation2017). Other information about the samples such as the intrinsic characteristics of the sample (e.g. origin, type of variety), processing and/or presentation should be also evaluated and considered along with the quantitative information (e.g. analyte concentration) during the assessment of the calibration model (Cozzolino Citation2020). For example, in terms of sample presentation, the position from which the infrared measurement is collected from a sample can affect the performance of the model (Cozzolino Citation2020).
A flow chart summarizing the development of calibration models between the reference data and the spectra is shown in .
Figure 2. Development of infrared spectroscopy-based calibration models for determination of compounds as glucosinolates and isothiocyanates. The images used in this figure are copyright free or have been downloaded from BioRender.com.
4. Summary of systematic search findings
A total of 14 research articles fulfilled the inclusion criteria defined in the previous section. Out of these articles, 13 reported the development of NIR spectroscopy-based calibration models for the determination of glucosinolates whereas only one article targeted isothiocyanates. Out of the 13 articles that included the analysis of glucosinolates, eight considered vegetables such as broccoli (n = 3), kale (n = 2), rocket (n = 1), cabbage and Brussels sprouts (n = 1), and cabbage only (n = 1). Five reported the analysis of one or more oilseeds such as brown mustard (n = 2), rapeseed (n = 2), pennycress (n = 1), and combined Brassicaceae seeds (n = 1). One article focused on the prediction of isothiocyanates in broccoli. A summary of the different types of vegetables and seeds and the information about the calibrations developed are presented in .
Table 1. Summary of the NIR calibration models used to determine glucosinolate content in vegetables and oilseeds.
5. Prediction of glucosinolates using infrared spectroscopy
As shown in , glucosinolates are characterized by a thioglucose group conjugated to a core sulfonated isothiocyanate group with an R-group side chain which is determined by the species. Key features of the glucosinolate core structure can be identified using IR spectroscopy, which include O-H stretching and deformation, S-H or C-H stretch first overtones of methyl groups, and C-H stretching by methylene groups (Toledo-Martin et al. Citation2017). The absorbance bands at specific wavenumbers in the IR region reported during the analysis of leaves from rape (Brassica napus ssp. pabularia) and rocket (Eruca vesicaria) are described in . Glucosinolates show an intricate spectral detail in the region 2000–2500 nm owing to the stretches between bonds N-H, O-H, and C-C. This region therefore has shown to be an effective range for the quantification of glucoraphanin, glucobrassicin, 4-methoxyglucobrassicin, neoglucobrassicin, and total glucosinolates in freeze-dried broccoli (Hernández-Hierro et al. Citation2012). Alternatively, the region between 950–1650 nm has also been used to successfully quantify glucobrassicin, from the first overtone of the O-H stretching (1420 and 1425 nm) and the first overtone of the indole N-H asymmetric stretch (1450 nm) (Renner and Fritz Citation2020).
Table 2. Specific wavelengths in the NIR region reported to measure total glucosinolates in leaves and plants as reported by different authors.
Hydrolysis of a glucosinolate catalyzed by the enzyme myrosinase yields a β-D-glucose and an unstable thiohydroximate-O-sulfonate intermediate which under the right conditions is rearranged into an isothiocyanate compound. This general structure is also shown in , with a R-group, dependant on the glucosinolate precursor, attached to the isothiocyanate group -N=C=S. Their characteristic stretching modes have been obtained through IR and Raman spectroscopy particularly in the MIR region between 1990–2280 cm−1, including a distinctive asymmetric doublet at approximately 1990–2150 cm−1 from the asymmetric stretching of the NCS group (Yenagi, Nandurkar, and Tonannavar Citation2012). This doublet is accompanied by an overtone band at ≈990–1090 cm−1, assigned to the symmetric stretching of the NCS group. The observed frequency of the -NCS stretching bands can be displaced by temperature (Campbell et al. Citation1995), isothiocyanate R-group, solvent/phase (Kniseley, Hirschmann, and Fassel Citation1967) of the compound amongst other factors. At lower frequencies, ≈400–600 cm−1, -NCS deformation vibrations (in-plane bending and out-of-plane bending) can be observed. The key features that are related to the isothiocyanate group are recorded in and characteristic bands for some pure glucosinolates and isothiocyanates are reported in .
Table 3. Specific wavenumbers in the MIR region used to measure isothiocyanate (i.e., NCS group) as reported by different authors.
Table 4. Characteristic bands in the MIR region reported to measure pure glucosinolates and isothiocyanates.
5.1. Prediction of glucosinolates in vegetables
5.1.1. Broccoli (Brassica oleracea var. italica)
Broccoli (Brassica oleracea var. italica) is considered one of the richest sources of glucosinolates (Bahadoran et al. Citation2012) as it can contain 47 to 806 mg/100 g fresh weight of total glucosinolates (Possenti et al. Citation2016). These compounds could represent about 0.2–2% of the dry weight of the broccoli head (Ilahy et al. Citation2020). The quality and glucosinolate content of broccoli is significantly affected by postharvest treatments including storage temperature, relative humidity, and processing conditions (Jones, Faragher, and Winkler Citation2006). It has been reported that 55% of broccoli glucoraphanin was lost after three days of storage at 20 °C in open boxes (Rangkadilok et al. Citation2002). A robust and rapid method that determines the glucosinolate content of broccoli can be useful to continuously monitor the glucosinolate content of broccoli during storage as defined by different authors. This will ensure that the highest possible glucosinolate content of broccoli is conserved for consumers.
A NIR calibration model was developed (Sahamishirazi et al. Citation2017) to determine the amount of individual, indolic, aliphatic, and total glucosinolates in open pollinating genotypes of broccoli (Brassica oleracea convar. botrytis var. italica). The individual glucosinolates analyzed using freeze-dried broccoli samples were glucoiberin, glucosinigrin, glucoraphanin, glucobrassicin, 4-methoxy glucobrassicin, and 1-methoxy glucobrassicin and were determined using HPLC (glucotropaeolin as an internal standard). The NIR spectra were collected between 400–2498 nm and calibration models were developed using MPLS. The R2 values reported for the calibration and validation ranged between 0.25–0.76 and 0.03–0.55, respectively (Sahamishirazi et al. Citation2017). The low R2 values suggested a poor correlation between the HPLC reference method and NIR data in both calibration and validation. The poor results could be due to the wide variation between the samples because of the lower number of samples (n = 100) from 12 new bred open pollinating genotypes of broccoli (Sahamishirazi et al. Citation2017). The RPD values of all the developed models were lower than 2.3, indicating that the models are not applicable for any purpose (Sahamishirazi et al. Citation2017). This study did not apply any treatments to the spectra and only used the NIR raw spectra.
The amount of total glucosinolates, glucobrassicin, glucoraphanin, 4-methoxy glucobrassicin, and neoglucobrassicin in freeze-dried broccoli has been determined using VIS/NIR spectroscopy (400–2500 nm) (Hernández-Hierro et al. Citation2012). The reference method used in this study was micellar electrokinetic capillary chromatography (Clarke Citation2010). The spectra were preprocessed and compared using different methods such as MSC, SNV, and de-trending. The calibration models were developed using MPLS. The best calibration model for determination of glucobrassicin, glucoraphanin, 4-methoxy glucobrassicin, and neoglucobrassicin, and total glucosinolates were based on the use of detrend 1,4,4,1, detrend 1,4,4,1, SNV 1,4,4,1, MSC 2,8,6,1, and none 2,10,10,1; respectively. The calibration and validation statistics are summarized in . The best model was identified based on the highest R2 and lowest SECV and SEP values. The R2 values of the calibration models suggested that the model for glucobrassicin showed good correlation (0.89) which is promising, while the models for 4-methoxy glucobrassicin, and neoglucobrassicin, and total glucosinolates had an R2 value in the range of 0.65–0.81 suggesting that the models may be used for quantitative analysis. However, the model of glucoraphanin showed very poor correlation (R2 = 0.40).
The use of NIR hyperspectral imaging to quantify and map the total glucosinolates content in freeze-dried broccoli florets has been reported (Hernández-Hierro et al. Citation2014). The hyperspectral images of broccoli were obtained using the wavelength region of 950–1650 nm. After selecting the regions of interest and random 500 pixels, the NIR spectra were pretreated by SNV to remove the effects of light scattering, and PCA was used with a T2 Hotelling value to remove spectral outliers. The calibration model was developed using PLS regression with the reference data obtained from micellar electrokinetic capillary chromatography. The model was only validated using cross-validation with SECV of 1.80 μmol/g.
5.1.2. Kale (Brassica oleracea var. sabellica)
Kale (Brassica oleracea var. sabellica) is another major source of glucosinolates, and its total glucosinolate content can vary between 2 to 100 µmol/g dry weight (Samec, Urlic, and Salopek-Sondi Citation2019) or 17 to 345 mg/100 g fresh weight (Possenti et al. Citation2016). The glucosinolate content of kale can be affected by cultivar environment factors (e.g. temperature, relative humidity, and carbon dioxide concentration) (Chowdhury, Kiraga, et al. Citation2021), phenological stage at harvest, and degree of insect damage during the growth stage (Velasco et al. Citation2007), as well as the cultivar (Hahn et al. Citation2016). Ideally, the concentration of these compounds should be monitored during plant growth.
Total glucosinolates and individual glucosinolates (e.g. progoitrin, sinigrin, glucoraphanin, gluconapin, 4-hydroxyglucobrassicin, glucobrassicin, 4-methoxyglucobrassicin, and neoglucobrassicin) were measured in freeze-dried Brassica alborgrabra (Chinese kale) samples (Chen et al. Citation2014) using NIR spectroscopy (400 to 2500 nm) and HPLC (glucotropaeolin as an internal standard). The NIR spectra were preprocessed using SNV, and de-trending where MPLS was used as a regression method (Chen et al. Citation2014). The statistical parameters obtained in this study are outlined in . The calibration model had a high R2 of prediction (0.92) and validation (0.91), low SECV (2.96 μmol/g DW) and SEP (2.87 μmol/g DW), and fair RPD (3.59) for determination of total glucosinolates. Based on these findings, it can be concluded that NIR spectroscopy is an efficient method to determine the total glucosinolate content in Chinese kale and can be used for determination purposes. Likewise, in terms of specific glucosinolates, the model was fair in predicting the amount of gluconapin, glucobrassicin, and neoglucobrassicin (). However, the model was not suitable for the quantification of progoitrin and 4-hydroxyglucobrassicin due to high standard error values and low RPD value (). The RPD value obtained for the calibration model of sinigrin and 4-methoxyglucobrassicin indicated that the calibration model was not suitable for quantification purposes. On the other hand, the model of glucoraphanin showed a fair RPD (3.18), however, the model had a R2 of validation (0.67). One of the strengths of this study was that researchers considered collecting kale samples at different stages of maturity. This sampling strategy can increase the variability in the chemical and physical characteristics of the sample set and could potentially have a greater effect on the robustness of the calibration (e.g. commercial application), compared to models that may only consider mature samples.
NIR spectroscopy has also been used to estimate the amount of sinigrin, glucobrassicin, 4-ethoxyglucobrassicin, neoglucobrassicin, and gluconapin in freeze-dried kale leaf samples (Chowdhury, Ngo, et al. Citation2021). In this study, HPLC with sinigrin as an external standard, was used to obtain the reference data. The raw spectra (300–1050 nm) were subjected to smoothing and first derivative treatment to remove outliers and enhance resolution. Different regression models were applied and compared: PCR, PLSR, and stepwise multiple linear regression (SMLR). Key wavelengths in the range 740–1000 showed a strong correlation with the glucosinolate content in kale leaves. Comparing the regression methods, SMLR was more effective in developing models compared to PCR and PLSR. SMLR models showed good performance (R2 > 0.82) with different spectral transformations of the targeted glucosinolates.
5.1.3. Rocket (Eruca sativa)
Rocket (Eruca sativa), also known as arugula, is another vegetable from the Brassicaceae family that has been reported to have high glucosinolate content (Signore et al. Citation2020). The common range of total glucosinolates in rocket is 2–140 mg/100 g fresh weight (Possenti et al. Citation2016). Although high amounts of phytochemicals in vegetables and other food products are desirable, the increase in the content of some compounds may have drawbacks as well. For example, high glucosinolate content in rocket leaves has been reported to reduce consumer acceptability due to an increase in bitterness and pungency (Bell, Lignou, and Wagstaff Citation2020). Thus, to ensure consumer acceptance it will be helpful to monitor the amount of glucosinolates in rocket leaves before harvesting them or processing them. A quick infrared spectroscopy-based method to determine glucosinolates in rocket can be useful in ensuring desirable glucosinolate levels for consumers.
The amount of total glucosinolates, glucoraphanin, glucosativin, and glucoerucin in freeze-dried rocket leaves was predicted using VIS/NIR spectroscopy (400 to 2500 nm) (Toledo-Martin et al. Citation2017). The calibration models were developed using LC coupled with UV detection (sinigrin as an external standard). The NIR spectra were preprocessed using the first and second derivative, SNV-DT as baseline offset correction. The best pretreatment of the NIR spectra was the second derivative (2,5,5,2) with SNV-DT. According to the external validation, the RPD values were in the range of 1.5–2.5 suggesting that the models are only suitable for qualitative analysis. The RER values of the external validation suggest that the models of glucoraphanin and glucoerucin are useful for quality control due to their good precision, whereas the models for total glucosinolates and glucosativin could be used for screening purposes. Interestingly, by interpreting the loadings, it was suggested by the authors that proteins and cellulose highly contributed to the calibration models developed for the determination of glucosinolates.
5.1.4. Cabbage (Brassica oleracea var. capitata f. alba) and Brussel sprouts (Brassica oleracea var. gemmifera)
Cabbage (Brassica oleracea var. capitata f. alba) and Brussel sprouts (Brassica oleracea var. gemmifera) contain a wide range of glucosinolates. Brussel sprouts can contain 18 to 390 mg/100 g fresh weight of total glucosinolates, while white, savoy, and red cabbage contain an average glucosinolate content of 148, 88, and 81 mg/100 g fresh weight, respectively (Possenti et al. Citation2016). Industrial thermal treatments can significantly affect their glucosinolate content (Lafarga et al. Citation2018). The quality of cabbage, including the glucosinolate content, is affected by different blanching, freezing, steaming, and microwaving treatments (Chenani Saleh et al. Citation2021; CitationTabart et al. 2018). Thus, this indicates that industrial processes in food production need to be optimized and continuously monitored to sustain these beneficial compounds.
A study developed and compared NIR calibration models for the determination of glucobrassicin in fresh and freeze-dried cabbage and Brussels sprouts was reported (Renner and Fritz Citation2020). The reference method used in this study was HPLC using sinigrin as an external standard. The authors applied three different combinations of pretreatments to the spectra namely SNV and de-trending, first derivative, and the combination of first derivative SNV and de-trending. The R2 of calibration and cross validation using of freeze-dried samples, decreased from 0.90 and 0.80 (using raw spectra) to 0.63 and 0.41 (using SNV + de-trending), respectively. In addition, the first derivative treatment of the NIR spectra did not improve the correlation between the variables (R2 remained the same), in comparison to using the NIR raw spectra. The calibration models developed based using the NIR spectra of fresh samples had high RMSEC. For instance, the model developed using the NIR raw spectra of fresh samples had a calibration RMSEC of 40.47, while the model using the raw spectra of the dried samples had a calibration RMSEC of 2.17. According to the authors, the developed models are suitable for rough screening of glucobrassicin in cabbage and Brussels sprout fresh (RPD = 2.3) and dry (RPD = 2.4) leaf tissues.
Determination of the glucosinolate content of Chinese cabbage (Brassica rapa) using UV-VIS-NIR spectroscopy (250–1100 nm) has been investigated (Ngo et al. Citation2014). The amount of glucoraphanin, sinigrin, glucoalyssin, gluconapin, glucobrassicanapin, glucobrassicin, 4-methoxyglucobrassicin, gluconasturtinn, neoglucobrassicin, and total glucosinolates in freeze-dried samples was determined using HPLC as the reference method. The obtained spectra were preprocessed using the Savitzky-Golay smoothing method, and SML regression with different mathematical transformations was used to develop the calibration models. Key wavelengths in the region between 300–490 nm (visible) and 1010–1030 nm (short wavelengths in the NIR region) were identified and associated with glucosinolates. The calibration model of glucoraphanin showed excellent correlation (R2 = 0.95) where those for 4-methoxyglucobrassicin (R2 = 0.89) and neoglucobrassicin (R2 = 0.89) showed good correlation. However, this study was unsuccessful in developing calibration models for other glucosinolates.
5.2. Prediction of glucosinolates in oilseeds
Oilseeds are considered as energy dense foods due to their high oil content. They are mainly grown to produce edible oil (Adeleke and Babalola Citation2020). Oilseeds are commonly analyzed for their oil, protein, glucosinolate, chlorophyll, specific fatty acids (such as oleic and linoleic acids), and total saturated fat content as quality control measurements (Barthet, Petryk, and Siemens Citation2020; Sen et al. Citation2018). It is essential to monitor the quality parameters to improve cultivars and perform effective germplasm screening. The glucosinolate content of oilseeds is an important factor that can influence the quality and nutritional value of oilseeds. Although glucosinolates have remarkable bioactivity, high concentrations of certain glucosinolates can negatively impact the oilseed quality due to their anti-nutritive activity. For example, the ideal amount of glucosinolates in rape oilseeds is <25 μmol/g (Bocianowski, Liersch, and Nowosad Citation2020). High levels of alkenyl glucosinolates (progoitrin and gluconapin) and their respective isothiocyanates in rapeseed-based meals can lead to palatability-related concerns. Currently, the decrease the total glucosinolate content of rape oilseeds to <18 µmol/g is a key breeding target (Jhingan et al. Citation2023). The amount of glucosinolates in oilseeds is mainly affected by their genotype. For example, brown mustard can contain 26 to 354 mg/100 g fresh weight of total glucosinolates (Possenti et al. Citation2016). The use of IR spectroscopy, as a robust analytical method, becomes very attractive when dealing with the analysis of traits in large groups of oilseeds such as glucosinolate analysis that has a significant impact on the oilseed quality.
5.2.1. Brown mustard (Brassica juncea)
The determination of glucosinolates and composition of Brassica juncea seeds, commonly known as brown mustard seeds, using VIS/NIR spectroscopy has been reported (Gohain et al. Citation2021). In this study, the authors comprehensively profiled the glucosinolate content in several seed samples (n = 641) of Brassica juncea chemotypes. They considered four genotypes namely core Brassica juncea germplasm panel, F1 double haploid mapping population, high indolic glucosinolate expressing transgenic lines, and high glucoraphanin accumulating transgenic lines which all contribute to enhance the variability in the data set used to develop the calibration models. These authors quantified the amount of sinigrin, gluconapin, glucobrassicanapin, glucoiberin, glucoraphanin, glucoalyssin, glucobrassicin, 4-hydroxyglucobrassicin, 4-methoxy-glucobrassicin, total glucosinolates, aliphatic glucosinolates, and indolic glucosinolates using HPLC (with sinalbin as an internal standard). The NIR reflectance spectrum (400–2500 nm) was measured in all the samples where the Norris method was used to minimize spectral variability. Then, mathematical treatments were applied using different derivative combinations. The mathematical treatment (2,5,5,2) was found to be the most effective in processing the spectra. The calibration models using MPLS were not suitable for the quantification of glucobrassicanapin, 4-methoxy glucobrassicanapin, and glucobrassicin due to low R2 values in validation (0.34, 0.47, and 0.56, respectively). According to the RPD values, the model developed for sinigrin is the only one that is suitable for quality control (RPD = 5.35), while the models of gluconapin, 4-hydroxy glucobrassicin, and total indolic glucosinolates (3.1 < RPD < 4.9) were considered as fair and can be used for screening purposes. The model developed for glucoiberin, aliphatic glucosinolates and total glucosinolates can be used for rough screening (breeding programmes) (2.4 < RPD < 3.0), while the other models are not suitable for determination purposes. According to the RER values, the model developed for sinigrin, gluconapin, and total indolic glucosinolates is good for quantification and can give values with high precision (RER > 15). The model of glucoalyssin, glucobrassicin, aliphatic glucosinolates, and total glucosinolates can be useful for quality control (10 < RER < 15), while the other models can be used for sample screening only. One of the highlights of this study is the use of an external validation set. The researchers not only assess the validation of their models by using Brassica juncea samples, but they also considered other Brassica species (Brassica rapa, Brassica nigra, Brassica napus, and Brassica carinata) to validate their models as well as they investigated the robustness of the models upon using other Brassica species. The use of an external validation set revealed that the models which were developed using Brassica juncea could also be suitable to estimate some of the key glucosinolates across other oilseeds samples from the same species.
Another study targeted only the total glucosinolates content, rather than the individual glucosinolates present in Brassica juncea seeds (Sen et al. Citation2018). This study used a reference method based on a chemical assay that produces a complex compound of glucosinolates and tetrachloropalladate (II) and the measurements were obtained using an enzyme-linked immunoassay (ELISA) reader. The IR spectra (400–2500 nm) obtained were pretreated with mathematical transformations: derivatives, multiple scatter correction and smoothing. The first derivative treatment (1,4,4,1) was used for resolving overlapped peaks and removing the baseline variations. The prediction model was developed based on MPLS. The detailed statistical analysis of calibration and validation of this study are outlined in . The calibration model developed for the determination of total glucosinolate content of Brassica juncea seeds had high R2 of calibration (0.939), cross-validation (0.865), and external validation (0.951) values suggesting a strong correlation in the model. One of the factors that could have potentially contributed to this strong correlation is the range in composition (large sample variability). Based on a recent study, the amount of glucosinolates in different Brassica juncea seeds can vary between 45 and 90 μmol/g (Zhang et al. Citation2022). The glucosinolate content of the seed samples used to develop the calibration model reported by Sen and collaborators (2018) ranged between 28 and 114 μmol/g with about 200 samples.
5.2.2. Rapeseed (Brassica napus subsp. napus)
A handheld NIR instrument was used to develop a calibration model to determine the total glucosinolates, and other biomolecules, in rapeseed samples (Barthet, Petryk, and Siemens Citation2020). The seeds samples were obtained from three different years/harvest sourced from different regions of Canada. The reference method used to obtain the total glucosinolates value was HPLC, and the NIR spectra were collected in the range between 908–1776 nm. The spectra were treated initially with SNV followed by a Savitzky-Golay second derivative transformation. Kernel PLS method was used as a regression method to develop the calibration model. The developed model for the determination of total glucosinolates was very poor and not suitable for quantification or screening purposes (RPD < 1.5) based on the statistical analysis performed. In this study, 13 factors were used to develop the calibration model. The use of a high number of factors during calibration development can determine a risk of overfitting (e.g. redundancy) (Dayananda and Cozzolino Citation2022). It has been reported that to obtain a robust calibration model few factors should be used (Williams, Dardenne, and Flinn Citation2017). Therefore, the results of this study need to be considered carefully.
Another study evaluated the use of NIR spectroscopy to develop a model for the determination of glucosinolates in Brassica napus seeds (rapeseed) (Sen et al. Citation2018). The same research group developed a calibration model for total glucosinolates in brown mustard discussed earlier (Sen et al. Citation2018). The reference method and spectral treatments were the same as the ones used for Brassica juncea seeds. The detailed statistical validation results of this study are outlined in . The calibration model developed for the determination of total glucosinolate content of Brassica napus seeds had high R2 of calibration (0.865), cross-validation (0.866), and external validation (0.986) values, suggesting a strong correlation in the model. The glucosinolate content of the seeds sample used to develop the calibration model, ranged between 14 to 127 μmol/g, indicating a good range in composition (e.g. variability) that have a direct influenced in the quality of the results (e.g. calibration statistics).
5.2.3. Pennycress (Thlaspi arvense)
The seed composition, including total glucosinolates, of a pennycress (Thlaspi arvense) population, has been evaluated using NIR spectroscopy to aid in rapid domestication and utilization of this product in the USA (Chopra et al. Citation2019). This study increased the sample variability by initially subjecting the seeds to different chemical and irradiation treatments to induce the creation of mutants before planting. The harvested seeds were then used for NIR spectroscopy analysis. The reference method used for quantification of total glucosinolates was based on the use of UV spectroscopy involving extraction with methanol and treatment with sulfatase to release desulfoglucosinolates for quantification. The NIR spectra were collected in the wavelength range between 950–1650 nm. The reported wet lab range for total glucosinolate content was 20–180 µmol/g, while the reported range using NIR was 24–154 µmol/g. There was a moderate correlation (R2 = 0.78) between the reference and NIR predicted values of total glucosinolates. The moderate correlation could have been influenced by the seed characteristics (e.g. variations in seed coating, maturity, and volume), low variability in certain seed traits in the model, or errors associated with using the mirror cup modules during the collection of the spectra.
5.2.4. Combined species
A comprehensive study developed an NIR spectroscopy-based calibration model for the measurement of quality characteristics, including the total glucosinolate content, of six Brassicaceae family seeds (Brassica napus (rapeseed), Brassica carinata (Ethiopian mustard), Brassica juncea (brown mustard), Brassica rapa (field mustard), Sinapis alba (white mustard), and Camelina sativa (camelina)) (Oblath et al. Citation2016). The reference method in this research was based on HPLC. After PCA analysis three different mathematical treatments were applied to develop the calibration models namely 0,0,1,1 (raw data), 1,4,4,1 (first derivative), and 2,4,4,1 (second derivative). These treatments were tested with and without the combination of SNV, detrend and scatter correction. The MPLS regression method was used to build the calibration models based only on the data treated with 1,4,4,1 and SNV/detrend scatter correction. The detailed statistical analysis of the calibration and validation results of this study are outlined in . The calibration model of glucosinolates had an R2 of 0.92, SEC of 8.19 μmol/g, and an RPD of 2.3. These results suggested that the model can only be used for qualitative analysis. The outcomes of cross-validation were not reported; thus, the applicability of the calibration model is questionable.
6. Prediction of isothiocyanates using infrared spectroscopy
Isothiocyanates can be produced upon the rupture of cell structures and the resulting interaction of plant myrosinase with glucosinolates during post-harvest and food manufacturing/preparation processes. Only one study based on ATR-FTMIR spectroscopy has been reported to determine the total isothiocyanates in terms of sulforaphane equivalents in broccoli (Revelou et al. Citation2017). The reference method used to determine isothiocyanate content was based on UV-VIS spectroscopy, utilizing a cyclo-condensation reaction with vicinal dithiols (Zhang et al. Citation1992). In this assay, five-membered cyclic condensation products are formed together with corresponding free amines (λmax = 365 nm). The averaged MIR spectra (2150–2020 cm−1) of the standard solutions were correlated with the reference data by the leave-one-out cross-validation technique. The selected MIR region of sulforaphane showed one of the two doublet peaks (≈2120 and ≈2058 cm−1) that is correlated with the asymmetric stretching of N=C=S, with the peak ≈2120 cm−1 increasing with the increase of sulforaphane concentration. The developed PLS calibration model for the determination of broccoli isothiocyanates had an R2 value of 0.99 suggesting a very strong correlation between the MIR and the reference method. The root-mean-square error of cross-validation (RMSECV) and RMSEP of the performed cross validation was 1.74 and 2.17, respectively. Although the high R2 value indicated an excellent linear relationship, and the small variation between RMSECV and RMSEP suggested the robustness of the model, further parameters (such as RPD and RER) were not reported by the authors to evaluate the robustness of the developed models for quantification and quality control purposes.
7. Limitations and future perspectives
The use of NIR and MIR spectroscopy has been reported by different authors to measure the content of gluscosinolates in different vegetables and oilseed samples. However, there are several challenges and limitations associated with the determination of glucosinolates using infrared spectroscopy. Limitations are associated with the lack of a robust and agreed reference method (e.g. HPLC, ELISA, and UV-VIS) used to quantify these compounds to develop calibration models. One of the challenges is related with the relatively low quantities of these compounds. It has been highlighted that low concentrations of certain glucosinolates can lead to errors in the reference values obtained as well as with the detection of these compounds using IR spectroscopy (e.g., LOD and LOQ). A common strategy explored and reported to overcome this challenge was to combine the glucosinolate content of a specific class together. For example, some indolic glucosinolates, such as 4-hydroxyglucobrassicin, 4-methoxyglucobrassicin, and neoglucobrassicin that are usually found in low quantities, were added together, where the sum of the amount of these glucosinolates and glucobrassicin reported as total indolic glucosinolates was used as input during calibration development. This has been an effective strategy to improve the performance of the calibration models using IR spectroscopy. It is important to mention that although some glucosinolates are present at low concentrations, and in many cases the use of NIR spectroscopy cannot measure them directly, the interactions or the existence of correlations between these compounds and other chemical components make the calibrations possible.
None of the current studies evaluated in this review have considered assessing the accuracy of the reference method used to quantify the glucosinolates. None of these studies have reported the SEL SET, LOD, or LOQ. Therefore, the accuracy and efficiency of the reference method is unknown making the evaluation of the IR calibration model difficult. Many factors affect the accuracy of the reference methods. This includes the extraction efficiency in which several variables can affect the amount of extracted glucosinolates from the vegetable or plant matrix, such as extraction temperature, time, volume of solvent, composition of solvent, ratio of amount of dry sample to extracting solvent, and personal errors associated with the extraction processes. The reference method selected for analyzing the extract (e.g., HPLC and UV-VIS spectroscopy) also contributes to the efficiency and reliability of the reference method.
All the studies evaluated in this review investigated the use of NIR spectroscopy to determine glucosinolates and isothiocyanates in different type of samples. NIR spectroscopy has shown very promising results in the determination of total glucosinolates in oilseeds. However, the prediction of these compounds in other vegetables is not clear. In addition, not reports on the use of other spectroscopies, such as MIR or Raman spectroscopy were found.
Another limitation of these studies is related to the lack of robust interpretation of the IR spectra as well as loadings or regression coefficients used to predict the different glucosinolate-rich sources. A wide variation in the selection of wavelengths used can be seen in the current studies. Comprehensively evaluating and understanding the key features of glucosinolate and isothiocyanate related bands in the IR spectra of these vegetables and seeds will help in identifying the best ranges of the IR spectrum to use to develop the calibration models. It has been reported that since a portion of the structure of glucosinolates is derived from amino acids, this can result in some indirect correlations between the protein and total glucosinolate content, determining the poor robustness and prediction ability of the calibration models developed. Therefore, a careful interpretation of loadings and regression coefficients is of importance.
Furthermore, some of the current studies have not reported in addition to the R2 and SECV or SEP, other important statistical parameters such as the RPD, RER, slope, and bias to evaluate the ability and robustness of the developed model to be used as quantitative, quality control or screening (qualitative analysis) methods. A comprehensive report of these statistics will be required to aid and guide users in understanding the applications and limitations of the use of NIR spectroscopy. In addition, most of the calibration models reported in these studies were only based on the use of cross-validation and most of the reported models were tested without using an independent data set.
Other information about the samples such as sample origin, harvest season, genotype, cultivar, preparation, and presentation to the instrument have been not reported or defined in the scientific papers reviewed. Evaluating this information together with the chemical composition will provide with a better understanding of the pros and cons of the calibration models developed, as well as their potential commercial applications.
To conclude, further research on the utilization of IR spectroscopy should include assessing the reference method used to develop a calibration, the evaluation of suitable preprocessing and sample presentation method (e.g. reflectance and ATR), the comparison and study of the most effective wavelength or wavenumber range (e.g. NIR or MIR) and the validation of the calibration model using independent samples.
Authors’ contributions
Ali Ali Redha: Conceptualization; Data curation; Formal analysis; Investigation; Methodology; Resources; Software; Visualization; Writing—original draft; Writing—review & editing. Luciana Torquati: Data curation; Investigation; Methodology; Writing—review & editing; Supervision. Faye Langston: Resources; Visualization; Writing—original draft; Writing—review & editing. Geoffrey R. Nash: Writing—review & editing; Supervision. Michael J. Gidley: Writing—review & editing; Supervision. Daniel Cozzolino: Writing—review & editing; Supervision.
Supplemental Material
Download PDF (320.5 KB)Acknowledgments
The authors would like to acknowledge the funding made available from PepsiCo, Inc. which supported this work. The views expressed in this report are those of the authors and do not necessarily represent the position of policy of PepsiCo, Inc.
Disclosure statement
Author Faye Langston PhD is fully sponsored by PepsiCo, Inc. All authors declare no conflicts of interest.
Additional information
Funding
References
- Adeleke, B. S., and O. O. Babalola. 2020. Oilseed crop sunflower (Helianthus annuus) as a source of food: Nutritional and health benefits. Food Science & Nutrition 8 (9):4666–84. doi: 10.1002/fsn3.1783.
- Aghajanzadeh, T. A., M. Reich, S. Kopriva, and L. J. De Kok. 2018. Impact of chloride (NaCl, KCl) and sulphate (Na2SO4, K2SO4) salinity on glucosinolate metabolism in Brassica rapa. Journal of Agronomy and Crop Science 204 (2):137–46. doi: 10.1111/jac.12243.
- Aghajanzadeh, T. A., D. H. Prajapati, and M. Burow. 2020. Copper toxicity affects indolic glucosinolates and gene expression of key enzymes for their biosynthesis in Chinese cabbage. Archives of Agronomy and Soil Science 66 (9):1288–301. doi: 10.1080/03650340.2019.1666208.
- Akbari, E., and M. Namazian. 2020. Sulforaphane: A natural product against reactive oxygen species. Computational and Theoretical Chemistry 1183:112850. doi: 10.1016/j.comptc.2020.112850.
- Bahadoran, Z., M. Tohidi, P. Nazeri, M. Mehran, F. Azizi, and P. Mirmiran. 2012. Effect of broccoli sprouts on insulin resistance in type 2 diabetic patients: A randomized double-blind clinical trial. International Journal of Food Sciences and Nutrition 63 (7):767–71. doi: 10.3109/09637486.2012.665043.
- Bahoosh, S. R., Y. Shokoohinia, and M. Eftekhari. 2022. Glucosinolates and their hydrolysis products as potential nutraceuticals to combat cytokine storm in SARS-COV-2. DARU Journal of Pharmaceutical Sciences 30 (1):245–52. doi: 10.1007/s40199-022-00435-x.
- Barba, F. J., N. Nikmaram, S. Roohinejad, A. Khelfa, Z. Zhu, and M. Koubaa. 2016. Bioavailability of glucosinolates and their breakdown products: Impact of processing. Frontiers in Nutrition 3:24. doi: 10.3389/fnut.2016.00024.
- Barthet, V. J., M. W. P. Petryk, and B. Siemens. 2020. Rapid nondestructive analysis of intact canola seeds using a handheld near‐infrared spectrometer. Journal of the American Oil Chemists’ Society 97 (6):577–89. doi: 10.1002/aocs.12335.
- Bec, K. B., J. Grabska, and C. W. Huck. 2022. In silico NIR spectroscopy - A review. Molecular fingerprint, interpretation of calibration models, understanding of matrix effects and instrumental difference. Spectrochimica Acta, Part A, Molecular and Biomolecular Spectroscopy 279:121438. doi: 10.1016/j.saa.2022.121438.
- Bell, L., S. Lignou, and C. Wagstaff. 2020. High Glucosinolate content in rocket leaves (diplotaxis tenuifolia and eruca sativa) after multiple harvests is associated with increased bitterness, pungency, and reduced consumer liking. Foods 9 (12):1799. doi: 10.3390/foods9121799.
- Blekkenhorst, L. C., J. M. Hodgson, J. R. Lewis, A. Devine, R. J. Woodman, W. H. Lim, G. Wong, K. Zhu, C. P. Bondonno, N. C. Ward, et al. 2017. Vegetable and fruit intake and fracture-related hospitalisations: A prospective study of older women. Nutrients 9 (5):511. doi: 10.3390/nu9050511.
- Bocianowski, J., A. Liersch, and K. Nowosad. 2020. Genotype by environment interaction for alkenyl glucosinolates content in winter oilseed rape (Brassica napus L.) using additive main effects and multiplicative interaction model. Current Plant Biology 21:100137. doi: 10.1016/j.cpb.2020.100137.
- Bro, R., and A. K. Smilde. 2014. Principal component analysis. Analytical Methods 6 (9):2812–31. doi: 10.1039/C3AY41907J.
- Cabello-Hurtado, F., M. Gicquel, and M.-A. Esnault. 2012. Evaluation of the antioxidant potential of cauliflower (Brassica oleracea) from a glucosinolate content perspective. Food Chemistry 132 (2):1003–9. doi: 10.1016/j.foodchem.2011.11.086.
- Campanella, B., V. Palleschi, and S. Legnaioli. 2021. Introduction to vibrational spectroscopies. ChemTexts 7 (1):787–798. doi: 10.1007/s40828-020-00129-4.
- Campbell, N. L., C. J. Gillis, D. Klapstein, W. M. Nau, W. J. Balfour, and S. G. Fougère. 1995. Vibrational spectra and conformational behaviour of carbonyl isothiocyanates X-CO-NCS, X = F, Cl, Br, MeO, EtO, and acetyl isothiocyanate CH3-CO-NCS. Spectrochimica Acta Part A: Molecular and Biomolecular Spectroscopy 51 (5):787–98. doi: 10.1016/0584-8539(94)00199-L.
- Chartoumpekis, D. V., P. G. Ziros, J. G. Chen, J. D. Groopman, T. W. Kensler, and G. P. Sykiotis. 2019. Broccoli sprout beverage is safe for thyroid hormonal and autoimmune status: Results of a 12-week randomized trial. Food and Chemical Toxicology 126:1–6. doi: 10.1016/j.fct.2019.02.004.
- Chen, G. C., W. P. Koh, J. M. Yuan, L. Q. Qin, and R. M. van Dam. 2018. Green leafy and cruciferous vegetable consumption and risk of type 2 diabetes: Results from the Singapore Chinese Health Study and meta-analysis. The British Journal of Nutrition 119 (9):1057–67. doi: 10.1017/S0007114518000119.
- Chen, J., L. Li, S. Wang, X. Tao, Y. Wang, A. Sun, and H. He. 2014. Assessment of glucosinolates in Chinese kale by near-infrared spectroscopy. International Journal of Food Properties 17 (8):1668–79. doi: 10.1080/10942912.2012.678535.
- Chen, R., X. J. Wang, Y. Y. Zhang, Y. Xing, L. Yang, H. Ni, and H. H. Li. 2019. Simultaneous extraction and separation of oil, proteins, and glucosinolates from Moringa oleifera seeds. Food Chemistry 300:125162. doi: 10.1016/j.foodchem.2019.125162.
- Chenani Saleh, N., S. A. Hossein Goli, M. Haghighi, and J. Keramat. 2021. The effects of blanching, and freezing on quality properties of frozen cabbage (Brassica oleracea var. capitata). Journal of Plant Process and Fucntion 10 (43):35–42.
- Chopra, R., N. Folstad, J. Lyons, T. Ulmasov, C. Gallaher, L. Sullivan, A. McGovern, R. Mitacek, K. Frels, K. Altendorf, et al. 2019. The adaptable use of Brassica NIRS calibration equations to identify pennycress variants to facilitate the rapid domestication of a new winter oilseed crop. Industrial Crops and Products 128:55–61. doi: 10.1016/j.indcrop.2018.10.079.
- Chowdhury, M., S. Kiraga, M. N. Islam, M. Ali, M. N. Reza, W. H. Lee, and S. O. Chung. 2021. Effects of temperature, relative humidity, and carbon dioxide concentration on growth and glucosinolate content of kale grown in a plant factory. Foods 10 (7):1524. doi: 10.3390/foods10071524.
- Chowdhury, M., V.-D. Ngo, M. N. Islam, M. Ali, S. Islam, K. Rasool, S.-U. Park, and S.-O. Chung. 2021. Estimation of glucosinolates and anthocyanins in kale leaves grown in a plant factory using spectral reflectance. Horticulturae 7 (3):56. doi: 10.3390/horticulturae7030056.
- Clarke, D. B. 2010. Glucosinolates, structures and analysis in food. Analytical Methods 2 (4):310. doi: 10.1039/b9ay00280d.
- Connolly, E. L., M. Sim, N. Travica, W. Marx, G. Beasy, G. S. Lynch, C. P. Bondonno, J. R. Lewis, J. M. Hodgson, and L. C. Blekkenhorst. 2021. Glucosinolates from cruciferous vegetables and their potential role in chronic disease: Investigating the preclinical and clinical evidence. Frontiers in Pharmacology 12:767975. doi: 10.3389/fphar.2021.767975.
- Cozzolino, D. 2020. The sample, the spectra and the maths-the critical pillars in the development of robust and sound applications of vibrational spectroscopy. Molecules 25 (16):3674. doi: 10.3390/molecules25163674.
- Cuellar-Núñez, M. L., G. Loarca-Piña, M. Berhow, and E. Gonzalez de Mejia. 2020. Glucosinolate-rich hydrolyzed extract from Moringa oleifera leaves decreased the production of TNF-α and IL-1β cytokines and induced ROS and apoptosis in human colon cancer cells. Journal of Functional Foods 75:104270. doi: 10.1016/j.jff.2020.104270.
- Dayananda, B., and D. Cozzolino. 2022. Beyond the Black Box—practical considerations on the use of chemometrics combined with sensing technologies in food science applications. Chemosensors 10 (8):323. doi: 10.3390/chemosensors10080323.
- De Nicola, G. R., P. Rollin, E. Mazzon, and R. Iori. 2014. Novel gram-scale production of enantiopure R-sulforaphane from Tuscan black kale seeds. Molecules (Basel, Switzerland) 19 (6):6975–86. doi: 10.3390/molecules19066975.
- Dolatparast, B., G. Ahmadvand, B. Mehrshad, J. Hazemi, and M. Y. Hamedani. 2021. Effect of late sowing date on agronomic and quality traits of four winter oilseed rape (Brassica napus) cultivars in Hamedan, Iran. Agrotechniques in Industrial Crops 1 (4):160–9. doi: 10.22126/ATIC.2022.7202.1027.
- Eghbalpour, F., M. Aghaei, M. Ebrahimi, M. R. Tahsili, M. Golalipour, S. Mohammadi, and Y. Yazdani. 2020. Effect of indole-3-carbinol on transcriptional profiling of wound-healing genes in macrophages of systemic lupus erythematosus patients: An RNA sequencing assay. Lupus 29 (8):954–63. doi: 10.1177/0961203320929746.
- ElMasry, G., N. Mandour, S. Al-Rejaie, E. Belin, and D. Rousseau. 2019. Recent applications of multispectral imaging in seed phenotyping and quality monitoring - An overview. Sensors 19 (5):1090. doi: 10.3390/s19051090.
- Ernst, I. M., K. Palani, T. Esatbeyoglu, K. Schwarz, and G. Rimbach. 2013. Synthesis and Nrf2-inducing activity of the isothiocyanates iberverin, iberin and cheirolin. Pharmacological Research 70 (1):155–62. doi: 10.1016/j.phrs.2013.01.011.
- Esbensen, K. H., P. Geladi, and A. Larsen. 2014. The RPD myth…. NIR News 25 (5):24–8. doi: 10.1255/nirn.1462.
- Esteve, M. 2020. Mechanisms underlying biological effects of cruciferous glucosinolate-derived isothiocyanates/indoles: A focus on metabolic syndrome. Frontiers in Nutrition 7:111. doi: 10.3389/fnut.2020.00111.
- Fearn, T. 2014. The Overuse of R2. NIR News 25 (5):32. doi: 10.1255/nirn.1464.
- Font, R., M. del Rio-Celestino, E. Cartea, and A. de Haro-Bailon. 2005. Quantification of glucosinolates in leaves of leaf rape (Brassica napus ssp. pabularia) by near-infrared spectroscopy. Phytochemistry 66 (2):175–85. doi: 10.1016/j.phytochem.2004.11.011.
- Gohain, B., P. Kumar, B. Malhotra, R. Augustine, A. K. Pradhan, and N. C. Bisht. 2021. A comprehensive Vis-NIRS equation for rapid quantification of seed glucosinolate content and composition across diverse Brassica oilseed chemotypes. Food Chemistry 354:129527. doi: 10.1016/j.foodchem.2021.129527.
- Golic, M., and K. B. Walsh. 2006. Robustness of calibration models based on near infrared spectroscopy for the in-line grading of stonefruit for total soluble solids content. Analytica Chimica Acta 555 (2):286–91. doi: 10.1016/j.aca.2005.09.014.
- Haghi, R. K., E. Pérez-Fernández, and A. H. J. Robertson. 2021. Prediction of various soil properties for a national spatial dataset of Scottish soils based on four different chemometric approaches: A comparison of near infrared and mid-infrared spectroscopy. Geoderma 396:115071. doi: 10.1016/j.geoderma.2021.115071.
- Hahn, C., A. Muller, N. Kuhnert, and D. Albach. 2016. Diversity of kale (Brassica oleracea var. sabellica): Glucosinolate content and phylogenetic relationships. Journal of Agricultural and Food Chemistry 64 (16):3215–25. doi: 10.1021/acs.jafc.6b01000.
- Halkier, B. A., and J. Gershenzon. 2006. Biology and biochemistry of glucosinolates. Annual Review of Plant Biology 57:303–33. doi: 10.1146/annurev.arplant.57.032905.105228.
- Hennig, K., R. Verkerk, M. Dekker, and G. Bonnema. 2013. Quantitative trait loci analysis of non-enzymatic glucosinolate degradation rates in Brassica oleracea during food processing. TAG. Theoretical and Applied Genetics. Theoretische Und Angewandte Genetik 126 (9):2323–34. doi: 10.1007/s00122-013-2138-1.
- Hernández-Hierro, J. M., C. Esquerre, J. Valverde, S. Villacreces, K. Reilly, M. Gaffney, M. L. González-Miret, F. J. Heredia, C. P. O’Donnell, and G. Downey. 2014. Preliminary study on the use of near infrared hyperspectral imaging for quantitation and localisation of total glucosinolates in freeze-dried broccoli. Journal of Food Engineering 126:107–12. doi: 10.1016/j.jfoodeng.2013.11.005.
- Hernández-Hierro, J. M., J. Valverde, S. Villacreces, K. Reilly, M. Gaffney, M. L. Gonzalez-Miret, F. J. Heredia, and G. Downey. 2012. Feasibility study on the use of visible-near-infrared spectroscopy for the screening of individual and total glucosinolate contents in broccoli. Journal of Agricultural and Food Chemistry 60 (30):7352–8. doi: 10.1021/jf3018113.
- Hooshmand, K., and I. S. Fomsgaard. 2021. Analytical methods for quantification and identification of intact glucosinolates in arabidopsis roots using LC-QqQ(LIT)-MS/MS. Metabolites 11 (1):47. doi: 10.3390/metabo11010047.
- Ilahy, R., I. Tlili, Z. Pek, A. Montefusco, M. W. Siddiqui, F. Homa, C. Hdider, T. R’Him, H. Lajos, and M. S. Lenucci. 2020. Pre- and post-harvest factors affecting glucosinolate content in broccoli. Frontiers in Nutrition 7:147. doi: 10.3389/fnut.2020.00147.
- Jhingan, S., H. J. Harloff, A. Abbadi, C. Welsch, M. Blumel, D. Tasdemir, and C. Jung. 2023. Reduced glucosinolate content in oilseed rape (Brassica napus L.) by random mutagenesis of BnMYB28 and BnCYP79F1 genes. Scientific Reports 13 (1):2344. doi: 10.1038/s41598-023-28661-6.
- Jones, R. B., J. D. Faragher, and S. Winkler. 2006. A review of the influence of postharvest treatments on quality and glucosinolate content in broccoli (Brassica oleracea var. italica) heads. Postharvest Biology and Technology 41 (1):1–8. doi: 10.1016/j.postharvbio.2006.03.003.
- Karimabad, M. N., M. Mahmoodi, A. Jafarzadeh, A. Darekordi, M. R. Hajizadeh, and G. Hassanshahi. 2019. Molecular targets, anti-cancer properties and potency of synthetic indole-3-carbinol derivatives. Mini Reviews in Medicinal Chemistry 19 (7):540–54. doi: 10.2174/1389557518666181116120145.
- Kiani, S., H. Akhavan-Niaki, S. Fattahi, S. Kavoosian, N. Babaian Jelodar, N. Bagheri, and H. Najafi Zarrini. 2018. Purified sulforaphane from broccoli (Brassica oleracea var. italica) leads to alterations of CDX1 and CDX2 expression and changes in miR-9 and miR-326 levels in human gastric cancer cells. Gene 678:115–23. doi: 10.1016/j.gene.2018.08.026.
- Kniseley, R. N., R. P. Hirschmann, and V. A. Fassel. 1967. The infrared spectra of alkyl isothiocyanates. Spectrochimica Acta Part A: Molecular Spectroscopy 23 (1):109–27. doi: 10.1016/0584-8539(67)80212-5.
- Lafarga, T., G. Bobo, I. Vinas, C. Collazo, and I. Aguilo-Aguayo. 2018. Effects of thermal and non-thermal processing of cruciferous vegetables on glucosinolates and its derived forms. Journal of Food Science and Technology 55 (6):1973–81. doi: 10.1007/s13197-018-3153-7.
- Luo, S., R. An, H. Zhou, Y. Zhang, J. Ling, H. Hu, and P. Li. 2022. The glucosinolate profiles of Brassicaceae vegetables responded differently to quick-freezing and drying methods. Food Chemistry 383:132624. doi: 10.1016/j.foodchem.2022.132624.
- Miao, H., W. Zeng, J. Wang, F. Zhang, B. Sun, and Q. Wang. 2021. Improvement of glucosinolates by metabolic engineering in Brassica crops. aBIOTECH 2 (3):314–29. doi: 10.1007/s42994-021-00057-y.
- Mohammadi, S., A. Memarian, S. Sedighi, N. Behnampour, and Y. Yazdani. 2018. Immunoregulatory effects of indole-3-carbinol on monocyte-derived macrophages in systemic lupus erythematosus: A crucial role for aryl hydrocarbon receptor. Autoimmunity 51 (5):199–209. doi: 10.1080/08916934.2018.1494161.
- Mohammadi, S., F. S. Seyedhosseini, N. Behnampour, and Y. Yazdani. 2017. Indole-3-carbinol induces G1 cell cycle arrest and apoptosis through aryl hydrocarbon receptor in THP-1 monocytic cell line. Journal of Receptor and Signal Transduction Research 37 (5):506–14. doi: 10.1080/10799893.2017.1360351.
- Montaut, S., W. D. Zhang, J. M. Nuzillard, G. R. De Nicola, and P. Rollin. 2015. Glucosinolate diversity in bretschneidera sinensis of Chinese origin. Journal of Natural Products 78 (8):2001–6. doi: 10.1021/acs.jnatprod.5b00338.
- Nambiar, D. M., J. Kumari, R. Augustine, P. Kumar, P. K. Bajpai, and N. C. Bisht. 2021. GTR1 and GTR2 transporters differentially regulate tissue-specific glucosinolate contents and defence responses in the oilseed crop Brassica juncea. Plant, Cell & Environment 44 (8):2729–43. doi: 10.1111/pce.14072.
- Narbad, A., and J. T. Rossiter. 2018. Gut glucosinolate metabolism and isothiocyanate production. Molecular Nutrition & Food Research 62 (18):e1700991. doi: 10.1002/mnfr.201700991.
- Ngo, V. D., D. K. Ryu, S. W. Kang, S. O. Chung, S. U. Park, S. J. Kim, and J. T. Park. 2014. Correlation between glucosinolate content and spectral reflectance of cabbage leaves using a spectrometer. ISHS. Acta Horticulturae 1037 (1037):285–92. doi: 10.17660/ActaHortic.2014.1037.33.
- Oblath, E. A., T. A. Isbell, M. A. Berhow, B. Allen, D. Archer, J. Brown, R. W. Gesch, J. L. Hatfield, J. D. Jabro, J. R. Kiniry, et al. 2016. Development of near-infrared spectroscopy calibrations to measure quality characteristics in intact Brassicaceae germplasm. Industrial Crops and Products 89:52–8. doi: 10.1016/j.indcrop.2016.03.022.
- Oerlemans, K., D. M. Barrett, C. Bosch Suades, R. Verkerk, and M. Dekker. 2006. Thermal degradation of glucosinolates in red cabbage. Food Chemistry 95 (1):19–29. doi: 10.1016/j.foodchem.2004.12.013.
- Oliviero, T., R. Verkerk, and M. Dekker. 2018. Isothiocyanates from brassica vegetables-effects of processing, cooking, mastication, and digestion. Molecular Nutrition & Food Research 62 (18):e1701069. doi: 10.1002/mnfr.201701069.
- Parrini, S., A. Acciaioli, O. Franci, C. Pugliese, and R. Bozzi. 2019. Near Infrared Spectroscopy technology for prediction of chemical composition of natural fresh pastures. Journal of Applied Animal Research 47 (1):514–20. doi: 10.1080/09712119.2019.1675669.
- Pedrini, S., and K. W. Dixon. 2020. International principles and standards for native seeds in ecological restoration. Restoration Ecology 28 (S3):S286–S303. doi: 10.1111/rec.13155.
- Possenti, M., S. Baima, A. Raffo, A. Durazzo, A. M. Giusti, and F. Natella. 2016. Glucosinolates in food. In Glucosinolates, eds. J. -M. Mérillon, and K. G. Ramawat, 1–46. Switzerland, Cham: Springer International Publishing.
- Prado, N. J., D. Ramirez, L. Mazzei, M. Parra, M. Casarotto, J. P. Calvo, D. Cuello Carrión, A. Z. Ponce Zumino, E. R. Diez, A. Camargo, et al. 2022. Anti-inflammatory, antioxidant, antihypertensive, and antiarrhythmic effect of indole-3-carbinol, a phytochemical derived from cruciferous vegetables. Heliyon 8 (2):e08989. doi: 10.1016/j.heliyon.2022.e08989.
- Rangkadilok, N., B. Tomkins, M. E. Nicolas, R. R. Premier, R. N. Bennett, D. R. Eagling, and P. W. J. Taylor. 2002. The effect of post-harvest and packaging treatments on glucoraphanin concentration in broccoli (Brassica oleracea var. italica). Journal of Agricultural and Food Chemistry 50 (25):7386–91. doi: 10.1021/jf0203592.
- Renner, I. E., and V. A. Fritz. 2020. Using Near-infrared reflectance spectroscopy (NIRS) to predict glucobrassicin concentrations in cabbage and brussels sprout leaf tissue. Plant Methods 16:136. doi: 10.1186/s13007-020-00681-7.
- Revelou, P. K., M. G. Kokotou, C. S. Pappas, and V. Constantinou-Kokotou. 2017. Direct determination of total isothiocyanate content in broccoli using attenuated total reflectance infrared Fourier transform spectroscopy. Journal of Food Composition and Analysis 61:47–51. doi: 10.1016/j.jfca.2017.01.020.
- Rohman, A., A. Windarsih, M. A. M. Hossain, M. R. Johan, E. Ali, and N. A. Fadzilah. 2019. Application of near- and mid-infrared spectroscopy combined with chemometrics for discrimination and authentication of herbal products: A review. Journal of Applied Pharmaceutical Science 9 (3):137–47. doi: 10.7324/japs.2019.90319.
- Ruiz-Alcaraz, A. J., M. A. Martinez-Sanchez, P. Garcia-Penarrubia, M. Martinez-Esparza, B. Ramos-Molina, and D. A. Moreno. 2022. Analysis of the anti-inflammatory potential of Brassica bioactive compounds in a human macrophage-like cell model derived from HL-60 cells. Biomedicine & Pharmacotherapy = Biomedecine & Pharmacotherapie 149:112804. doi: 10.1016/j.biopha.2022.112804.
- Safa, M., L. Jafari, F. Alikarami, R. Manafi Shabestari, and A. Kazemi. 2017. Indole-3-carbinol induces apoptosis of chronic myelogenous leukemia cells through suppression of STAT5 and Akt signaling pathways. Tumour Biology 39 (6):1010428317705768. doi: 10.1177/1010428317705768.
- Sahamishirazi, S., S. Zikeli, M. Fleck, W. Claupein, and S. Graeff-Hoenninger. 2017. Development of a near-infrared spectroscopy method (NIRS) for fast analysis of total, indolic, aliphatic and individual glucosinolates in new bred open pollinating genotypes of broccoli (Brassica oleracea convar. botrytis var. italica). Food Chemistry 232:272–7. doi: 10.1016/j.foodchem.2017.04.025.
- Samec, D., B. Urlic, and B. Salopek-Sondi. 2019. Kale (Brassica oleracea var. acephala) as a superfood: Review of the scientific evidence behind the statement. Critical Reviews in Food Science and Nutrition 59 (15):2411–22. doi: 10.1080/10408398.2018.1454400.
- Sarvan, I., R. Verkerk, M. van Boekel, and M. Dekker. 2014. Comparison of the degradation and leaching kinetics of glucosinolates during processing of four Brassicaceae (broccoli, red cabbage, white cabbage, Brussels sprouts). Innovative Food Science & Emerging Technologies 25:58–66. doi: 10.1016/j.ifset.2014.01.007.
- Segneanu, A. E., I. Gozescu, A. Dabici, P. Sfirloaga, and Z. Szabadai. 2012. Organic compounds FT-IR spectroscopy. In Macro To Nano Spectroscopy, edited by Jamal Uddin, 144. London: IntechOpen. doi: 10.5772/50183.
- Sen, R., S. Sharma, G. Kaur, and S. S. Banga. 2018. Near-infrared reflectance spectroscopy calibrations for assessment of oil, phenols, glucosinolates and fatty acid content in the intact seeds of oilseed Brassica species. Journal of the Science of Food and Agriculture 98 (11):4050–7. doi: 10.1002/jsfa.8919.
- Shahrajabian, M. H., W. Sun, and Q. Cheng. 2019. The most important pharmaceutical benefits of sulforaphane, a sulfur-rich compound in cruciferous. Research on Crop Ecophysiology 14 (2):66–75.
- Signore, A., L. Bell, P. Santamaria, C. Wagstaff, and M. C. Van Labeke. 2020. Red light is effective in reducing nitrate concentration in rocket by increasing nitrate reductase activity, and contributes to increased total glucosinolates content. Frontiers in Plant Science 11:604. doi: 10.3389/fpls.2020.00604.
- Song, L., and P. J. Thornalley. 2007. Effect of storage, processing and cooking on glucosinolate content of Brassica vegetables. Food and Chemical Toxicology 45 (2):216–24. doi: 10.1016/j.fct.2006.07.021.
- Su, W. H., and D. W. Sun. 2018. Fourier transform infrared and raman and hyperspectral imaging techniques for quality determinations of powdery foods: A review. Comprehensive Reviews in Food Science and Food Safety 17 (1):104–22. doi: 10.1111/1541-4337.12314.
- Tabart, J., J. Pincemail, C. Kevers, J.-O. Defraigne, and J. Dommes. 2018. Processing effects on antioxidant, glucosinolate, and sulforaphane contents in broccoli and red cabbage. European Food Research and Technology 244 (12):2085–94. doi: 10.1007/s00217-018-3126-0.
- Tan, Z., Z. Xie, L. Dai, Y. Zhang, H. Zhao, S. Tang, L. Wan, X. Yao, L. Guo, and D. Hong. 2022. Genome- and transcriptome-wide association studies reveal the genetic basis and the breeding history of seed glucosinolate content in Brassica napus. Plant Biotechnology Journal 20 (1):211–25. doi: 10.1111/pbi.13707.
- Theunis, M., T. Naessens, L. Peeters, M. Brits, K. Foubert, and L. Pieters. 2022. Optimization and validation of analytical RP-HPLC methods for the quantification of glucosinolates and isothiocyanates in Nasturtium officinale R. Br and Brassica oleracea. LWT 165:113668. doi: 10.1016/j.lwt.2022.113668.
- Toledo-Martin, E. M., R. Font, S. Obregon-Cano, A. D. Haro-Bailon, M. Villatoro-Pulido, and M. Del Rio-Celestino. 2017. Rapid and cost-effective quantification of glucosinolates and total phenolic content in rocket leaves by visible/near-infrared spectroscopy. Molecules 22 (5):851. doi: 10.3390/molecules22050851.
- Van Eylen, D., I. Oey, M. Hendrickx, and A. Van Loey. 2007. Kinetics of the stability of broccoli (Brassica oleracea Cv. Italica) myrosinase and isothiocyanates in broccoli juice during pressure/temperature treatments. Journal of Agricultural and Food Chemistry 55 (6):2163–70. doi: 10.1021/jf062630b.
- Velasco, P., M. E. Cartea, C. González, M. Vilar, and A. Ordás. 2007. Factors affecting the glucosinolate content of kale (Brassica oleraceaacephala group). Journal of Agricultural and Food Chemistry 55 (3):955–62. doi: 10.1021/jf0624897.
- Vo, Q. V., S. Rochfort, P. C. Nam, T. L. Nguyen, T. T. Nguyen, and A. Mechler. 2018. Synthesis of aromatic and indole alpha-glucosinolates. Carbohydrate Research 455:45–53. doi: 10.1016/j.carres.2017.11.004.
- Vo, Q. V., C. Trenerry, S. Rochfort, and A. B. Hughes. 2013. A total synthesis of (R, S) S -glucoraphanin. Tetrahedron 69 (41):8731–7. doi: 10.1016/j.tet.2013.07.097.
- Wang, J., H. Yu, Z. Zhao, X. Sheng, Y. Shen, and H. Gu. 2019. Natural variation of glucosinolates and their breakdown products in broccoli (Brassica oleracea var. italica) seeds. Journal of Agricultural and Food Chemistry 67 (45):12528–37. doi: 10.1021/acs.jafc.9b06533.
- Williams, P. 2014. The RPD statistic: A tutorial note. NIR News 25 (1):22–6. doi: 10.1255/nirn.1419.
- Williams, P., P. Dardenne, and P. Flinn. 2017. Tutorial: Items to be included in a report on a near infrared spectroscopy project. Journal of near Infrared Spectroscopy 25 (2):85–90. doi: 10.1177/0967033517702395.
- Williams, P., and K. Norris. 2001. Near-infrared technology in the agricultural and food industries. 2nd ed. Saint Paul, Minnesota: Cereals & Grains Assn.
- Wu, W., J. Chen, D. Yu, S. Chen, X. Ye, and Z. Zhang. 2021. Analysis of processing effects on glucosinolate profiles in red cabbage by LC-MS/MS in multiple reaction monitoring mode. Molecules 26 (17):5171. doi: 10.3390/molecules26175171.
- Yang, J., J. Wang, Z. Li, X. Li, Z. He, L. Zhang, T. Sha, X. Lyu, S. Chen, Y. Gu, et al. 2021. Genomic signatures of vegetable and oilseed allopolyploid Brassica juncea and genetic loci controlling the accumulation of glucosinolates. Plant Biotechnology Journal 19 (12):2619–28. doi: 10.1111/pbi.13687.
- Yasumoto, S., M. Matsuzaki, H. Hirokane, and K. Okada. 2010. Glucosinolate content in rapeseed in relation to suppression of subsequent crop. Plant Production Science 13 (2):150–5. doi: 10.1626/pps.13.150.
- Yenagi, J., A. R. Nandurkar, and J. Tonannavar. 2012. 2-Methoxyphenyl isocyanate and 2-methoxyphenyl isothiocyanate: Conformers, vibration structure and multiplet fermi resonance. Spectrochimica Acta, Part A, Molecular and Biomolecular Spectroscopy 91:261–8. doi: 10.1016/j.saa.2012.01.024.
- Zare, M., E. Zandi Esfahan, and A. Ghorbani. 2019. Forage quality of Salsola yazdiana and S. tomentosa in different growth stages in Saline Desert of Yazd Province, Iran. Journal of Rangeland Science 9 (2):104–13.
- Zeng, W., H. Tao, Y. Li, J. Wang, C. Xia, S. Li, M. Wang, Q. Wang, and H. Miao. 2021. The flavor of Chinese kale sprouts is affected by genotypic variation of glucosinolates and their breakdown products. Food Chemistry 359:129824. doi: 10.1016/j.foodchem.2021.129824.
- Zhang, C., H. Di, P. Lin, Y. Wang, Z. Li, Y. Lai, H. Li, B. Sun, and F. Zhang. 2022. Genotypic variation of glucosinolates and their breakdown products in mustard (Brassica juncea) seeds. Scientia Horticulturae 294:110765. doi: 10.1016/j.scienta.2021.110765.
- Zhang, Y., C.-G. Cho, G. H. Posner, and P. Talalay. 1992. Spectroscopic quantitation of organic isothiocyanates by cyclocondensation with vicinal dithiols. Analytical Biochemistry 205 (1):100–7. doi: 10.1016/0003-2697(92)90585-u.
- Zheng, C., G. A. Guirgis, H. Deeb, and J. R. Durig. 2007. On the structural parameters and vibrational spectra of CH3NCS, SiH3NCS and GeH3NCS. Journal of Molecular Structure 829 (1–3):88–110. doi: 10.1016/j.molstruc.2006.06.011.
- Zhou, B., W. Huang, X. Feng, Q. Liu, S. A. Ibrahim, and Y. Liu. 2022. Identification and quantification of intact glucosinolates at different vegetative growth periods in Chinese cabbage cultivars by UHPLC-Q-TOF-MS. Food Chemistry 393:133414. doi: 10.1016/j.foodchem.2022.133414.