
 ?Mathematical formulae have been encoded as MathML and are displayed in this HTML version using MathJax in order to improve their display. Uncheck the box to turn MathJax off. This feature requires Javascript. Click on a formula to zoom.
ABSTRACT
This study explores the role of a biostimulant derived from the seaweed Ascophyllum nodosum (AN) in mitigating salt stress in rice plants. The weekly (S+W) and biweekly (S+B) biostimulant treatments exhibited enhanced shoot and root biomass, maintained ionic balance, and increased pigment content (total chlorophyll increased by 26.35% and 31%, carotenoids by 11.90% and 16.67% in S+W and S+B treatments, respectively) compared to untreated salt-stressed plants (CS). Improved gas exchange parameters and PSII efficiency were observed in S+W and S+B treatments. AN-biostimulant treatments mitigated salt-induced oxidative stress by positively regulating the antioxidant defense system. Notably, a strong negative correlation was observed between antioxidants and oxidative markers. Furthermore, AN-biostimulant treatments induced key metabolites (organic acids, sugars, amino acids, flavonoids), emphasizing the integrated role of multiple pathways in enhancing salt tolerance in rice. These findings highlight the potential of AN biostimulants as eco-friendly tools for crop enhancement in challenging environments.
1. Introduction
Soil salinity has drastic effects on agricultural systems thereby significantly reducing the total area under cultivation and limiting the agricultural productivity. According to an estimation, fifty percent of the world’s arable land would be severely affected by high salt concentrations by the year 2050 (Shrivastava and Kumar Citation2015), and thus maintaining the food supply chain would be the biggest challenge in the coming few years. Many factors escalate the problem of soil salinity such as poor irrigation practices, the improper application of fertilizers, and industrial pollution (Mohanavelu et al. Citation2021). Sea level rise is another global issue that includes flooding and salinization, which can provoke serious consequences for water resources especially in coastal agricultural land and arid regions. Salt intrusion can have a negative impact on both surface and ground water that can influence the overall agricultural landscape in the region (Mazhar et al. Citation2022). The presence of salt ions adversely impacts several growth, physiological, and metabolic pathways, and significantly reduce the crop productivity.
During salt stress, some critical physiological processes are dramatically altered, particularly those involved in plant growth, development and survival. Under mild to moderate salt stress, osmotic effects are the most prominent, which prevent plants from absorbing water and mineral nutrients, leading to dehydration and/or stomatal closure, among other responses (Munns Citation2002; Chandrasekaran et al. Citation2019). Under more acute salinity, the hyperosmotic and hyperionic conditions induce increased accumulation of Na+ and Cl – ions in the soil solution resulting in toxicity effects in plant cells (Munns Citation2002; Chaves et al. Citation2009).
Water use efficiency (WUE) defines the relationship between plant productivity and water use and can be negatively regulated by many environmental factors including salt stress (Khataar et al. Citation2018). Some studies reported a strong relationship between WUE and nutrient uptake by plants and vice versa (Plett et al. Citation2020). Moreover, WUE is a complex trait which exhibits physiological response specifically linked with stomatal conductance, mesophyll conductance, photosynthetic biochemistry and photochemistry, all of which greatly affects WUE and efficiency of photosynthetic process (Flexas et al. Citation2004; Chaves et al. Citation2009; Hatfield and Dold Citation2019).
Soil salinity reduces plant photosynthetic efficiency through both direct and indirect mechanisms. Salt stress has a negative impact on all phases of photosynthesis and associated components, reducing plants’ overall photosynthetic capacity (Hnilickova et al. Citation2021). In the direct effects, salt stress has an adverse effect on major photosynthetic pigments (chlorophylls and carotenoids), and a decrease in their content is strongly linked to a decrease in photosynthetic rate (Shin et al. Citation2020). Moreover, several studies have conclusively demonstrated that salt stress reduces the maximum quantum yield of PSII (Fv/Fm) due to ion toxicity, implying that the PSII reaction centers are partially damaged or possibly inactivated (Shi-chu et al. Citation2019; Shahzad et al. Citation2021a). Furthermore, under salt stress, the utilization of energy by light-harvesting antennae (including PSI and PSII) is frequently inhibited, which eventually disrupts associated plant physiological activities (Hnilickova et al. Citation2021). According to current knowledge, increasing the photosynthetic water use efficiency (WUE), mineral nutrition, and photosynthesis efficiency are the most crucial targets for enhancing salinity tolerance and crop productivity for modern agriculture.
Plants exposed to high salt concentrations typically experience ion toxicity, which has a number of other secondary effects such as dehydration, stomatal closure, carbon cycle reduction, and accumulation of reactive oxygen species (ROS). The increased levels of ROS can be extremely harmful to plant organisms, as they could oxidize proteins, lipids, pigments, and nucleic acids, thus compromising cell integrity and consequently halting the cell functionality (Dumanović et al. Citation2021). However, plants have developed sophisticated molecular mechanisms to avoid these stressors, activating the antioxidant defense network, which contains both enzymatic and non-enzymatic antioxidant components (Sachdev et al. Citation2021). Notably, salt stress is a complex trait that is controlled by both genetic and non-genetic factors, thus the development of salt-tolerant cultivars is a very challenging task. In addition, the wide range of gene expression in various environmental conditions complicates our efforts to alleviate salt stress (Mousavi et al. Citation2019).
In the recent past, biostimulants have gained more attention, particularly because they can be applied to seeds, whole plants, or rhizospheres to replenish plant growth and development in unfavorable environments. According to a recent definition, a biostimulant is a formulated product of biological origin that improves plant productivity and ameliorate biotic/abiotic stress due to its unique composition of several biomolecules and/or microorganisms (Rouphael and Colla Citation2020). The mutualistic interaction of biostimulants with other microorganisms may stimulate several biological processes (Ali et al. Citation2022), and thus provide an alternative to agrochemicals and other synthetic fertilizers for increasing agricultural productivity. In general, biostimulants can be classified into five major categories that include humic substances, hydrolyzed proteins and nitrogen-containing compounds, microorganisms, seaweeds and plant extracts, and other inorganic compounds with biostimulant activities (Franzoni et al. Citation2022). The seaweed based biostimulants comprise a large group and are extracted from various seaweed species belonging to different taxonomic groups, such as brown, red, and green algae. Seaweeds are multicellular organisms that are mainly found in coastal and marine ecosystems, and are known for producing a variety of stress-related compounds to ensure their survival in extreme environments (Shukla et al. Citation2019). Among these, the extract from the brown alga Ascophyllum nodosum (AN), a seaweed, is extensively employed to enhance plant growth, development, and defense mechanisms against biotic and abiotic stress in various plant species (Gunupuru et al. Citation2019; Carmody et al. Citation2020). Several commercial AN-based biostimulants are now available in the market; however, their bioactivity and composition are not identical due to different extraction methods (Shukla et al. Citation2019). An interesting study demonstrates that the plant transcriptome was differently affected by the application of two biostimulant products based on AN extracts in Arabidopsis (Goñi et al. Citation2016). Other reports have also indicated that variations in plant growth and stress tolerance can arise from the utilization of different extraction methodologies, the varying quantities and availability of mixture of bioactive compounds within seaweed extracts (Dell'Aversana et al. Citation2021). Over time, the effectiveness of seaweed-based biostimulants has been shown to vary based on factors such as stress level, type of stress, extract characteristics, plant species, growth stage, and frequency of biostimulant application (Baltazar et al. Citation2021). The modes of action of seaweed extracts are not clearly understood. Therefore, investigating the impact of biostimulants on plant physiology and molecular pathways becomes imperative for forthcoming research, aiming to unveil their mechanisms and enhance their efficacy in variety of different plant species under challenging environmental conditions.
More than half of the world's population depends on rice, which is grown on six different continents. Rice is very sensitive to high salt concentrations at the early seedling stage, and screening rice at this stage saves time and resources to assess salt sensitivity and/or tolerance under the controlled environment (Kakar et al. Citation2019). Unfortunately, most rice cultivars in Asian countries could only tolerate a salinity threshold of 3 dSm−1, whereas, most salt-affected soils have ECe (electrical conductivity) above 4 dSm−1 (Hoang et al. Citation2016). The rise in sea level is another crucial factor for increased salinity in soils of many Asian countries situated near deltas of the river (Vuorinen et al. Citation2015). These unfavorable climate change-related plant growing conditions undoubtedly increase plant susceptibility to biotic stress (West et al. Citation2012), and abiotic stresses (Yu et al. Citation2022). Although some successes have been reported to improve salt tolerance in rice plants through genetic engineering (Raza et al. Citation2022), however, genetic manipulations are still considered less environment-friendly according to existing biosafety frameworks in many European and non-European countries (Eckerstorfer et al. Citation2019). Therefore, it is essential to find out alternative ways to enhance salt tolerance in challenging environments to ensure sustainable agricultural practices specifically for such an important crop that is consumed globally. Considering these environmental and legislative challenges, the utilization of eco-friendly AN-based biostimulants provides a great opportunity to mitigate salt stress in rice.
As previously mentioned, despite the manifold benefits of AN-biostimulants, a significant lack of understanding exists regarding the specific molecular, cellular, and physiological mechanisms with respect to salt stress tolerance conferred by its application in rice plants, particularly during the early growth stage. The stimulatory effect of AN-biostimulants is promising; however, the need for determining their optimal application rate and frequency during the growing season highlights the necessity for more targeted research. To our knowledge, no studies have systematically examined the role of weekly and biweekly AN-based biostimulant treatments on rice plants during salt stress. Specifically, very little is known about the role of foliar application of AN-biostimulant in improving enzymatic and non-enzymatic components of the antioxidant defense system in rice during salt stress. Thus, the aim of this study was to investigate the potential role of weekly and biweekly treatments of AN-based biostimulant on physiological, biochemical, and metabolic responses in alleviating salt stress in rice at the seedling stage. To achieve this goal, we assessed the impact of these treatments on rice plants, evaluating (a) plant growth, (b) mineral nutrient content, (c) photosynthesis rate and efficiency, (d) oxidative damage and antioxidant enzyme activities, (e) cellular redox status, (f) metabolite variation, and (g) phenylpropanoid gene expression and total flavonoid content.
2. Materials and methods
2.1. Plant material and growth conditions
The lowland rice (Oryza sativa L.) cultivar Zhonghua 11 (ZH11) was used in this study. ZH11 is a typical japonica rice which is considered as drought – and salt-sensitive, and have been utilized in several studies for abiotic stress (Lan et al. Citation2019; Xu et al. Citation2022). Seeds disinfection was carried out by dipping the rice seeds into 70% (v/v) alcohol for 10 min, then immediately rinsed with sterile distilled water. After that seeds were immersed in 0.5% sodium hypochlorite (w/v) for 15 min followed by gentle washing for 5 min to remove the residual chloride. The washing step was repeated at least four times. Seed germination were carried out by spreading the seeds on Whatman filter paper moistened with 10 mL half-strength Hoagland nutrient solution. The culture was then placed in a growth chamber at 28°C under a 12 h daylight period. Relative humidity was maintained at about 55-60% inside the growth chamber. About ten days old healthy seedlings (with uniform growth) were transferred to growth boxes containing half-strength Hoagland nutrient solution, and continue their growth under the greenhouse conditions for about a week for acclimation purposes. Rice plants were then transplanted in to soil pots (diameter 14.5 cm), containing the soil mixture (2:1, mixture of air dried soil and sterilized sand), under the greenhouse conditions. The temperature inside the greenhouse was maintained at 25 ± 2°C (appropriate for rice growth) throughout the experimental period with relative humidity of nearly 60%. Initially, four seedlings were transplanted into each pot, which was later thinned to two plants per pot. Pots were watered to maintain a minimal value of 75% of pot water-holding capacity.
2.2. Experimental design and treatments
To evaluate the effect of the biostimulant application on rice plants under salt stress, rice seedlings were grown under controlled greenhouse conditions for one week for adaptation purposes before experimental trials. For biostimulant treatments, the seaweed Ascophyllum nodosum (AN) derived extract Superfifty (BioAtlantis Ltd., Kerry, Ireland) was applied to the plants via foliar spraying. The AN-biostimulant solution, prepared with 2 mL of Superfifty per liter, contained the following composition: 6.28 mg free amino acids L−1 (of which 3.6% is minor amino acids), 3.53 mg L−1 carbohydrates, 2.67 mg L−1 organic acids, 0.91 mg L−1 of fatty acids and 314 mg L−1 of mineral nutrients.
As shown before in several studies, a 200 mM NaCl concentration is widely recognized as severe stress in rice plants, resulting in a considerable reduction in a variety of growth, molecular, cellular and physiological parameters (Soltabayeva et al. Citation2021; Shahzad et al. Citation2021a). For this reason, in this study, we have used 200 mM NaCl concentration for salt stress treatment. For salinity stress, plants were irrigated with saline water (200 mM NaCl solution was applied until required ECe: 20.6 dSm−1 was reached) twice a week for 30 days. The soil conductivity was determined on daily basis using the conductivity meter (ECTestr, Spectrum Technologies, Inc.). For non-stress control, plants were irrigated with nutrient solution (ECe of 1.2 dSm−1) and sprayed only with distilled water. For foliar application, the AN-biostimulant solution (applied as weekly and biweekly treatments) was uniformly sprayed on rice plants.
According to the experimental plan, a combination of two factors was tested: the salt stress and AN-biostimulant treatments. All the treatments designated for this study include: (1) control plants grown under non-stress (non-saline) conditions without AN-biostimulant treatments (CN); (2) plants grown under non-stress conditions and subjected to weekly AN-biostimulant treatment (N+W); (3) plants grown under non-stress conditions and subjected to biweekly AN-biostimulant treatment (N+B); (4) control plants grown under salt-stress conditions (200 mM NaCl) without AN-biostimulant treatments (CS); (5) salt stressed-plants subjected to weekly AN-biostimulant treatment (S+W); and (6) salt stressed-plants subjected to biweekly AN-biostimulant treatment (S+B). One week after the transplantation, plants (3rd leaf stage) were subjected to salt stress for four weeks by irrigation with saline solutions of 200 mM NaCl (ECe: 20.6 dSm−1). According to the experimental layout, the salt-stressed plants were sprayed for 4 weeks with AN-biostimulant as weekly (S+W) and biweekly treatments (S+B), until the end of the experimental period. The data calculated is based on four independent replicates of at least 10 plants for each treatment. The plant samples were harvested after 4 weeks and all the parameters were determined at that stage.
2.3. Assessment of growth traits
After four weeks of salt treatment, the phenotype of rice plants from all treatment groups was photographed, then the morphological growth parameters: shoot length (SL), root length (RL), shoot fresh weight (SFW), shoot dry weight (SDW), root fresh weight (RFW), and root dry weight (RDW) were subsequently measured. For evaluating mineral contents, the rice shoot tissue (leaf + sheath) was oven-dried at 70°C for 24 h and ground into fine powder. The relative water content (RWC) was measured in percentage as described previously (Hossain et al. Citation2020), using the following formula:
(1)
(1) where FW and DW are the fresh and dry weights of leaves, respectively, and TW is the turgid weight of the sample.
2.4. Determination of mineral nutrient contents
The concentration of potassium (K+), sodium (Na+), magnesium (Mg2+), and calcium (Ca2+) were measured using an H2SO4 – H2O2 digestion method (Thu et al. Citation2017), followed by atomic absorption spectrophotometry (Z5300 Polarized Zeeman Atomic Absorption Spectrophotometer, Hitachi, Tokyo, Japan).
2.5. Determination of chlorophyll contents and photosynthetic traits
After the salt stress treatment, 0.5 g fresh leaf samples were collected and weighed for subsequent pigment analysis. The leaf samples were then placed in Petri dishes with 5 mL acetone (80% v/v) and incubated in the dark. The next day, after overnight incubation, the optical density (OD) of samples was measured with a UV-1200 spectrophotometer (Shimadzu, Japan). According to Arnon (Citation1949), the absorbance was measured at 663 and 645 nm for chlorophyll a (Chl-a), and chlorophyll b (Chl-b), respectively. For carotenoids (Caro), the absorbance was measured at 470 nm. The content of Chl-a, Chl-b, total chlorophyll (TChl), and carotenoids (Caro) was calculated using the following equations:
(2)
(2)
(3)
(3)
(4)
(4)
(5)
(5) where V is the volume for acetone extract (in mL) and W is the fresh weight of the sample in grams (g).
Leaf gas exchange attributes were recorded for two hours between 9:00 am and 11:00 am by using fully expanded leaf of rice plants as described by earlier report (Shahzad et al. Citation2021b). Briefly, a portable photosynthesis system equipped with an LED (light-emitting diode) light source 6400–02 (LiCor-6400; LiCor Inc. Lincoln, Nebraska, USA) was used to analyze photosynthetic indicators including net photosynthetic rate (Pn), transpiration rate (Tr), stomatal conductance (Gs), intercellular CO2 (Ci), maximum quantum yield of photosystem II (Fv/Fm), and water use efficiency (WUE).
2.6 Oxidative stress parameters
2.6.1. Determination of hydrogen peroxide (H2O2)
A spectrophotometric method (absorbance measured at 390 nm) was used to measure the amount of hydrogen peroxide (H2O2) in fresh leaves (Velikova et al. Citation2000). Briefly, leaf samples (0.5 g) were ground in 3 mL of 5% (w/v) trichloroacetic acid (TCA) with activated charcoal (0.1 g) at chilling temperature. The homogenate was centrifuged at 14,000 g for 10 min. Potassium phosphate buffer (0.5 mL; 10 mM, pH 7) and potassium iodide (0.7 mL; 1 M) were added to the supernatant (0.5 mL). The absorbance of each sample was measured at 390 nm. A standard curve line (y = 0.1931x + 0.2207, R2 = 0.9995) in the concentration range of 5 to 60 nmol mL−1 was used to determine the final concentration of H2O2, and expressed as nmol g−1 FW. The limit of detection (LoD) and limit of quantitation (LoQ) were calculated using the least square method as 0.26 nmol mL−1 and 0.78 nmol mL−1, respectively.
2.6.2. Determination of superoxide (O2•−)
The superoxide (O2•−) concentration was measured by homogenizing fresh tissue (0.2 g) in 2.5 mL of potassium phosphate buffer (65 mM, pH 7.8) and centrifuging it at 5000 rpm. After mixing the 1.0 mL supernatant with 0.9 mL potassium phosphate buffer (65 mM) and 0.1 mL hydroxylamine hydrochloride (10 mM), this mixture was incubated for 20 min at 25°C. Subsequently, 300 µl each of sulfanilamide (17 mM) and naphthylamine (7 mM) were added to this solution, and the mixture was incubated again for 20 min. An absorbance measurement was taken at 530 nm after 20 min of incubation at 25°C, and calculations were made based on sodium nitrite (NaNO2) concentrations range (1-10 nmol mL−1) using a standard curve (y = 0.1086x + 0.0887, R2 = 0.9992), as described elsewhere (Sulochana and Arumugam Citation2020). The LoD and LoQ were calculated using the least square method as 0.77 nmol mL−1 and 2.33 nmol mL−1, respectively.
2.6.3. Determination of malondialdehyde (MDA)
The malondialdehyde (MDA) was monitored to determine levels of lipid peroxidation as previously described (Rao and Sresty Citation2000). The calculation was based on an extinction coefficient of 155 mM−1 cm−1. In order to assess the activity of lipoxygenase (LOX; EC 1.13.11.12) using purified enzyme, the previous method was used (Doderer et al. Citation1992), and the absorbance change at 234 nm of the linoleic acid was determined using an extinction coefficient of 25 mM−1 cm−1. The LOX activity was finally expressed in units of mg−1 protein.
2.7. Measurement of antioxidant enzyme activities (SOD, CAT) and total flavonoids content
Using pre-chilled mortar and pestle, leaf samples (0.2 g) of control and treated plants were extracted using 5 mL of 100 mM potassium phosphate buffer (pH 7.0) that contained 0.5% (v/v) Triton X-100, 1% (w/v) polyvinylpyrrolidone (PVP), and 0.1 mM EDTA. Next, this filtered and then centrifuged at 15 000 × g for 20 min at chilling temperature of 4°C. For enzyme assays, the supernatant obtained after centrifugation was used as a source for measuring enzymatic activities. In order to measure the superoxide dismutase (SOD; EC: 1.15.1.1) activity, a reaction mixture of 3 mL was prepared that contained 50 mM of phosphate buffer (pH 7.8), 13.0 μmol L−1 of methionine, 63.0 μmol L−1 of nitroblue tetrazolium (NBT), and 1.3 μmol L−1 of riboflavin, and 100 μL of enzyme extract. In the final step, riboflavin was added with gentle shaking and allowed to react for 10 min under fluorescent illumination of 15 watts to complete the reaction. The activity of SOD was determined by the inhibition of photochemical reduction of NBT at 560 nm (Sarker and Oba Citation2018). In order to estimate the catalase (CAT; EC: 1.11.1.6) activity, 100 μL extract of enzyme was added to one mL of potassium phosphate buffer, reaction was initiated by adding 100 μL H2O2, and absorbance was subsequently measured at 240 nm every 15 s during a two minute period, as described in the previous method (Sarker and Oba Citation2018).
The aluminum chloride assay was performed with little modifications to determine the total flavonoids (TFlav) content in samples (Shahzad et al. Citation2021a). In brief, 4 mg of the quercetin was dissolved in 1 mL of methanol (80% v/v) to form a stock solution. Next, the standard solutions of quercetin were prepared by serial dilutions using methanol. In a 10 ml test tube, 1 mL of diluted sample extracts, 3.6 mL distilled water, and 0.3 mL of 5% (w/v) NaNO2 were mixed and held for 5 min. Next, we added 0.3 mL of 10% (w/v) AlCl3 and after 10 min, 2 mL of NaOH (1 M) was added. The mixture was finally diluted up to 10 mL with distilled water, thoroughly mixed, and then solution was incubated for 40 min at room temperature. The absorbance of the reaction mixtures was measured against blank at 420 nm wavelength with a UV/VIS spectrophotometer (Thermo, Waltham, USA). The calibration curve (y = 0.2031x + 0.016, R2 = 0.9998) in the concentration range of 20–200 mg/mL was used to measure TFlav content in the test samples, and expressed in mg quercetin (QE) per gram of sample. The LoD and LoQ were calculated using the least square method as 0.44 mg mL−1 and 1.34 mg mL−1, respectively.
2.8. Metabolome analysis
The leaf samples from all the treatments (C, S, S+W, and S+B) were simultaneously harvested and stored at – 80°C after freezing in liquid nitrogen. The frozen samples were then ground to a fine powder and about 20 mg was used for extraction of metabolites as described earlier (Shahzad et al. Citation2021b). The extracted samples were then derivatized and analyzed by gas chromatography-mass spectrometry coupled with time-of-flight (TOF) mass spectrometry (GC/TOF-MS, Pegasus 4D, LECO Corporation, St. Joseph, MI, USA). A temperature of 260°C was maintained at the inlet end of the heat exchanger. In the initial stage, the temperature of the GC oven was set at 80°C and the solvent delay was 5 min, then the temperature was raised to 280°C with a rate of 5°C min−1 after the injection, and then the temperature was held at 280°C for 15 min. After adjusting the injection temperature to 280°C, the ion source temperature was adjusted to 200°C. A constant flow rate of 1 mL min−1 was used for the carrier gas. In order to normalize metabolic data, ribitol (an internal standard) was used. Initial peak detection and mass spectrum deconvolution were performed with Leco Chroma-TOF software v. 4.51. In this study, a comparison between a mass spectral library from the national institute of standards and technology (NIST, Gaithersburg, MD, USA), and the public domain mass spectrometry library from the Max Planck Institute (http://csbdb.mpimp-golm.mpg.de/), has been used to confirm the peak assignment of each metabolite.
2.9. Gene expression analysis of phenylpropanoid pathway
In this study, we extracted total RNA from rice leaves using a TaKaRa MiniBEST Plant RNA Extraction Kit (Takara Bio Inc., Japan) according to the manufacturer's instructions. Isolated RNA was analyzed by spectrophotometry and gel electrophoresis. For qPCR analysis, 1 mg RNA was reverse transcribed using PrimerScriptTM RT Reagent Kit with gDNA Eraser (Takara Bio Inc., Japan). Using the iCycler IQ Real-Time Detection System Software, threshold cycle values were calculated, and mRNA levels were quantified using 2−ΔΔCT method (Livak and Schmittgen Citation2001). To amplify the target cDNAs, primers were designed according to the rice genomes available in the databank. Supplementary Table 1 lists the specific primers used for each gene.
2.10. Statistical analysis
For morphological, physiological and biochemical parameters, the data were subjected to analysis of variance (ANOVA), and differences among treatment means were tested using Fisher’s protected least significance (LSD) test at the p ≤ 0.05 significance level using program Statistix (ver. 8.1). To better understand the association between studied traits and experimental factors, Pearson's correlation coefficient and PCA analyses were used. The heatmap, Pearson’s correlation, and Principal component analysis (PCA) was performed using the R software (version 4.1.0) for Windows (http://CRAN.R-project. org/).
3. Results
3.1. Effect of salinity and AN-biostimulant on rice plant growth
The rice plants without the AN-biostimulant treatments were adversely affected by salt stress (CS) in comparison to plants under the non-stress condition (CN). However, AN-biostimulant treatments significantly enhanced the tolerance of rice plants under salt stress (S+W and S+B treatments) relative to the salt-stressed control (CS) plants (). Although, some differences were observed between weekly and biweekly AN-biostimulant treatments in salt stress condition, such as salt stress slightly affected S+W plants, whereas S+B plants continue normal growth and did not show any significant symptoms of injury caused by salinity ().
Figure 1. Phenotype assessment of salt tolerance in rice plants. The phenotype of rice plants from all the treatment groups: unstressed control (CN); weekly biostimulant treatment under non-stress condition (N+W); biweekly biostimulant treatment under non-stress condition (N+B); salt stress (200 mM NaCl) control (CS); salt-stressed plants with weekly biostimulant treatment (S+W); and salt-stressed plants with biweekly biostimulant treatment (S+B).
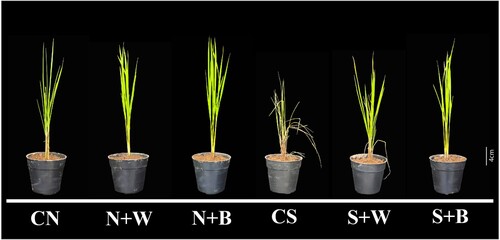
In this study, both the salt stress and AN-biostimulant treatments caused significant differences (p ≤ 0.05) on all the growth-related parameters (). Aerial (SL, SFW, SDW) and root (RL, RFW, and RDW) growth was significantly (p ≤ 0.05) decreased in the CS treatment as compared to CN (). The AN-biostimulant treatments (S+W and S+B) significantly (p ≤ 0.05) improved the growth parameters of rice plants as compared to the salt treatment without the AN-biostimulant application (Table 1). On average, SL and RL increased up to 12.74% and 23.94%, respectively in S+W plants, while biweekly AN-biostimulant further improved SL and RL growth up to 23.34% and 32.84%, respectively (). When stresses-plants were treated with AN-biostimulant on weekly basis, both the shoot biomass parameters (SFW and SDW) were increased significantly (p ≤ 0.05) up to 15.07% and 15.38%, while biweekly AN-biostimulant application improved SFW and SDW up to 24.66% and 23.08%, respectively, as compared with stress-only (CS) condition (). The root biomass (RFW and RDW) was also enhanced by AN-biostimulant treatments regardless of non-saline or saline conditions. RFW and RDW were significantly (p ≤ 0.05) higher in S+W (23.07% and 33.34%, respectively), and in S+B plants (up to 30.76% and 66.67%, respectively), relative to the CS condition (). Similarly, the RWC was reduced sharply in salt-stressed plants in comparison to unstressed control (CS vs. CN). Application of AN-biostimulant significantly recovered the RWC levels, which were enhanced up to 11.61% and 17.29%, in S+W and S+B, respectively, as compared to the CS condition ().
Table 1. Evaluation of AN-biostimulant treatments on the shoot and root biomass under non-stress and salinity stress conditions.
3.2. Effect of salinity and AN-biostimulant on mineral nutrient content
The mineral nutrients such as K+, Mg2+, and Ca2+ content was significantly (p ≤ 0.05) reduced, while the toxic Na+ ion was dramatically increased (up to 31.88%) in salt-stressed control plants (CS) as compared to unstressed (CN) plants (). Under the non-stress condition, biostimulant treatments slightly increased the K+, Mg2+, Ca2+, and Na+ ions relative to the respective control (CN). In comparison to the CS control, the content of K+, Mg2+ and Ca2+ ions were strongly improved, while the Na+ content was decreased in stressed-plants after the AN-biostimulant application (). For instance, the content of K+ was increased by 20.31% and 21.37% in S+W and S+B, respectively, as compared to the CS treatment (). Similarly, Mg2+ and Ca2+ ions were increased up to 28.39% and 20.68% in S+W, and 32.91% and 27.58% in S+B, respectively, as compared to the CS treatment (). Interestingly, even though the Na+ content was slightly higher in S+W and S+B plants as compared to the CN condition, however, its content was significantly lower relative to the CS control (). In addition, the K+/Na+ ratio, which is an important physiological indicator of salt tolerance, was recorded the lowest in the CS control (0.94±0.11) among all the other treatments in this study (). On the other hand, the K+/Na+ value was efficiently maintained at high levels (as observed in unstressed control plants) after the biostimulant applications. For instance, the K+/Na+ ratio was 1.47 in S+W plants and 1.53 in S+B plants (). These observations were also correlated with improved growth attributes of AN-biostimulant-applied plants during salt stress. Overall, these results suggest a strong positive influence of AN-biostimulant on growth parameters, particularly in biweekly AN-biostimulant plants, under the salt stress condition.
Table 2. Evaluation of AN-biostimulant treatments on the mineral nutrient contents in rice plants duringnon-stress and salinity stress conditions.
3.3. Effect of salinity and AN-biostimulant on pigment contents and photosynthetic efficiency
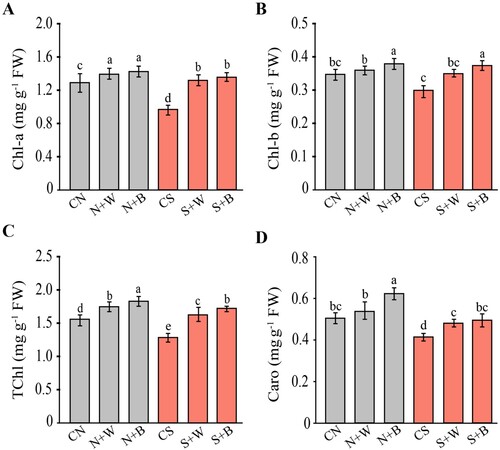
For this purpose, the impact of AN-biostimulant application on pigment contents and photosynthetic parameters under standard and salt stress conditions have been analyzed. In the non-stress condition, application of AN-biostimulant slightly increased all the pigment contents as compared to the respective control. During the salt stress condition, Chl-a content declined significantly (p ≤ 0.05) up to 0.98 mg/g FW in the CS plants relative to CN control (1.27 mg/g FW), but increased significantly after weekly and biweekly (S+W and S+B) AN-biostimulant treatments in comparison to the CS control (A). Similarly, Chl-b content was reduced (p ≤ 0.05) up to 0.31 mg/g FW in salt-stressed plants as compared to CN control (0.34 mg/g FW), while it was not significantly increased (up to 0.34 mg/g FW and 0.37 mg/g FW) in S+W and S+B treatments, respectively, in comparison to the CS control (B). On average, the TChl in salt-only treatment was decreased by 19.87% as compared to the unstressed control (C). With the application of AN-biostimulant, TChl was increased by 26.35% and 31% in S+W and S+B treatments, respectively, as compared to the CS control (C). The carotenoid content (Caro) was also decreased in response to salt stress by almost 17.64% as compared to the unstressed control. Under the non-stress condition, AN-biostimulant treatments also enhanced the Caro content relative to the CN control. During salt stress, even though the Caro content was slightly lower in AN-biostimulant treated plants compared with the CN treatment, but, its level was markedly higher in S+W and S+B treatments (increased by 11.90% and 16.67%, respectively) relative to the CS control (D). In the non-stress condition, AN-biostimulant application (N+W and N+B) also enhanced the Caro content relative to the respective control (CN).
Figure 2. Quantification of the pigment contents in control and AN-biostimulant treated plants under the non-stress and salinity stress conditions. The contents of (A) chlorophyll a (Chl-a), (B) chlorophyll b (Chl-b), (C) total chlorophyll (TChl), and (D) carotenoid (Caro). Data presented are the means ± SE (n = 4) and the significant difference between the means calculated at p ≤ 0.05 using the LSD test.
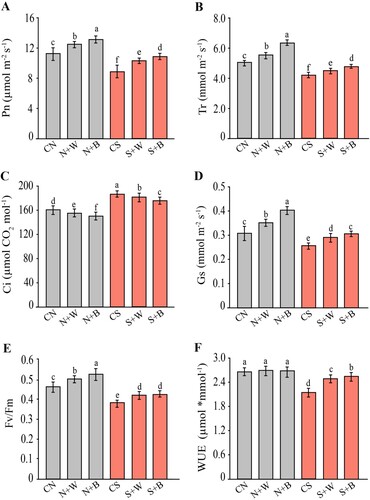
To better characterize the effect of salt stress and AN-biostimulant on photosynthesis, several important photosynthetic-related parameters were determined (). In the non-stress condition, most photosynthetic parameters were enhanced due to the application of the AN-biostimulant (N+W and N+B treatments), while WUE remained unchanged and Ci slightly decreased, relative to the CN control. Under the salt-stress condition, most of the photosynthetic-related parameters were negatively affected in salt-only treatment, except for Ci that significantly increased, as compared to the unstressed control (C). Interestingly, the AN-biostimulant application greatly alleviated the negative impact of salinity on photosynthetic attributes of rice plants during salt stress condition. Results showed a significant increase of Pn by 14.96% and 20.66%, Tr by 17.44% and 21.13%, Gs by 20.83% and 29.16%, Fv/Fm by 16.21% and 18.91%, and WUE up to 17.05% and 18.43% in S+W and S+B treatments, respectively, as compared to the CS control (). On the contrary, the level of intercellular CO2 (Ci) was slightly lower in S+W and S+B plants (declined by 7.94% and 10.67%, respectively), as compared to the CS control (C). Taken together, these results reveal how the AN-biostimulant regulates and maintains photosynthetic rate and efficiency in rice plants under salt stress conditions, particularly in the case of biweekly AN-biostimulant treatments.
Figure 3. Evaluation of the photosynthetic parameters in control and AN-biostimulant treated plants under the non-stress and salinity stress conditions. (A) Net photosynthetic rate (Pn), (B) transpiration rate (Tr), (C) Intercellular CO2 (Ci), (D) stomatal conductance (Gs), (E) maximum efficiency of photosystem II (Fv/Fm), and (F) Water use efficiency (WUE). Data presented are the means ± SE (n = 4) and the significant difference between the means calculated at p ≤ 0.05 using the LSD test.
3.4. Effect of salinity and AN-biostimulant on the oxidative damage in rice plants
The salinity-induced oxidative stress in rice plants was determined in terms of the generation rate of reactive oxygen species (H2O2 and O2•−), and lipid peroxidation (MDA and LOX) activity. Salt-stress markedly increased (p ≤ 0.05) the accumulation of H2O2 and O2•− by 45.61% and 38.52%, respectively, in the salt-stressed plants (CS) compared to the unstressed control (A and B). In the non-stress condition, the application of AN-biostimulant slightly increased the generation of H2O2 and O2•− content with respect to CN (A and B). In contrast, under salt-stress conditions, the AN-biostimulant significantly (p ≤ 0.05) decreased the generation rate of H2O2 and O2•− in the S+W and S+B treatments relative to the CS control (A and B).
Figure 4. Evaluation of oxidative stress indicators in control and AN-biostimulant treated plants under the non-stress and salinity stress conditions. The measurement of (A) hydrogen peroxide (H2O2), (B) superoxide anion (O2•−), (C) lipid peroxidation (MDA, malondialdehyde), and (D) lipoxygenase activity (LOX) in rice plants Data presented are the means ± SE (n = 4) and significant difference between the means calculated at p ≤ 0.05 using the LSD test.
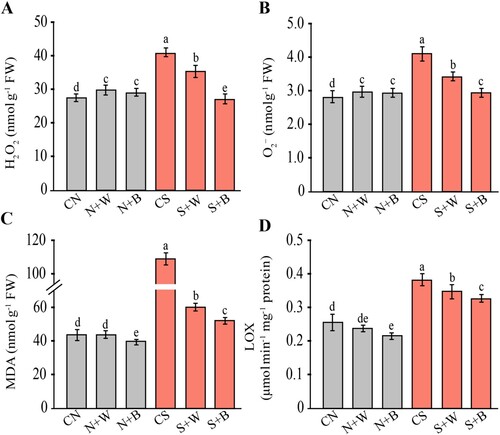
Similarly, MDA and LOX activity increased remarkably by 156.89% and 46.15% in stressed plants as compared to unstressed control (C and D). In this case, AN-biostimulant mitigated the effect of oxidative stress thereby lowering the MDA and LOX activity up to 44.93% and 10.52% in S+W, while decreased by 52.41% and 15.78% in S+B treatment, respectively, in comparison to the CS control (C and D).
These results clearly indicate that the addition of the AN-biostimulant regulates ROS accumulation and mitigates oxidative damage, particularly in the case of biweekly AN-biostimulant treatments.
3.5. Effect of salinity and AN-biostimulant on the cellular redox homeostasis
The activities of antioxidant enzymes including superoxide dismutase (SOD), and catalase (CAT) were analyzed. In salt-stressed rice plants (CS), the SOD and CAT activities were markedly reduced (16.81% and 14.56%, respectively) compared to the CN control (A). In contrast, the enzyme activities were significantly (p ≤ 0.05) enhanced in stressed plants treated with AN-biostimulant. The SOD enzyme activity was increased more prominently up to 61.25 U/g FW and 64.52 U/g FW (251.80% and 270.59%) in S+W and S+B, respectively, relative to the CS control (A). Similarly, the CAT activity was sharply increased up to 94.11 U/g FW and 160.46 U/g FW (60.76% and 174.10%) in S+W and S+B, respectively, as compared to the CS control (B).
Figure 5. Evaluation of the antioxidant enzymes and related transcripts in control and AN-biostimulant treated plants under the non-stress and salinity stress conditions. The measurement of (A) superoxide dismutase (SOD) activity (B) catalase (CAT) activity, (C) gene expression of OsSOD1, OsSOD2, OsSOD3, and (D) gene expression of OsCATa, OsCATb, and OsCATc. Data presented are the means ± SE (n = 4) and the significant difference between the means calculated at p ≤ 0.05 using the LSD test. The heatmap has been generated based on the fold-change values in the treated sample when compared with the unstressed control. The color scale for fold-change values is given on the left panel.
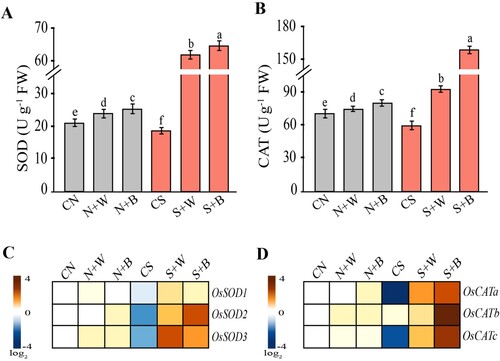
The expression of SOD and CAT genes in plants exposed to salt stress and treated with or without AN-biostimulant have also been evaluated. The heatmap showing the expression profile of SOD (OsSOD1, OsSOD2, OsSOD3) and CAT genes (OsCATa, OsCATb and OsCATc), which clearly indicated a significant difference (p ≤ 0.05) between salt-stressed control plants and those treated with AN-biostimulant. A marked down-regulation in the expression of SOD and CAT genes was observed in salt-only treatment (C and D), except for OsCATb; whose expression slightly increased in the CS plants (D), compared to the unstressed CN control. A remarkable up-regulation of SOD and CAT genes was noticed in S+W and S+B treatments as compared to the CS control (C and D). Under the non-stress condition, the transcripts of these genes were moderately enhanced in the weekly and biweekly biostimulant treatments (N+W and N+B treatments), compared with the respective control (C and D). Overall, these genes were prominently expressed in the biweekly biostimulant treatment (S+B) relative to the weekly treatment (S+W) during salinity stress. Taken together, these results indicate that the application of AN-biostimulant significantly influences antioxidant activities and related transcripts, particularly in the biweekly AN-biostimulant treatments. This highlights its significant role in scavenging ROS during salt stress in rice plants.
3.6. Effect of salinity and AN-biostimulant on the metabolic homeostasis of rice plants
To determine the responses of each treatment to the accumulation of metabolite contents, we compared the metabolite profile of the control, salt-only, and AN-biostimulant treatments under the non-stress and stress conditions (). The heatmap shows a total of 66 key metabolites which were detected and quantified using GC-TOF-MS from leaf samples and were classified as organic acids (20), sugars (19), amino acids (16), and others (11) ().
Under the non-stress condition, most of the metabolites were moderately enhanced after the biostimulant treatments relative to the CN control, however, the accumulation of these metabolites was higher in S+W and S+B treatments, as compared with both the controls. Most of the organic acids were decreased in response to salt-only treatment relative to the unstressed control, whereas the levels of organic acids were largely increased in salt-stressed plants after the weekly and biweekly AN-biostimulant treatments. For example, ascorbic acid, fumaric acid, and shikimic acid was prominently enhanced in S+B treatment while remarkably decreased in the CS control ( and ). These metabolites accumulated in lower amounts in S+W treatment than in S+B treatment ().
Figure 6. Differential metabolites profile in control and AN-biostimulant treated rice plants under the non-stress and salinity stress conditions. The differential profile of 66 key metabolites (organic acids, sugars, amino acids, and others) are presented as heatmap. The heatmap shows the log2 fold change ratios and the purple color codes representing increase in metabolites, whereas the yellow color codes show decrease of metabolites. The data is representative of three independent experiments.
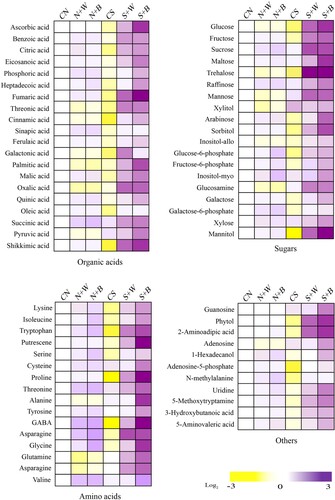
Figure 7. Box plots showing the relative abundance of selected metabolites (organic acids, sugars, and amino acids) that show significant variation in control and AN-biostimulant treated plants under non-stress and salinity stress conditions.
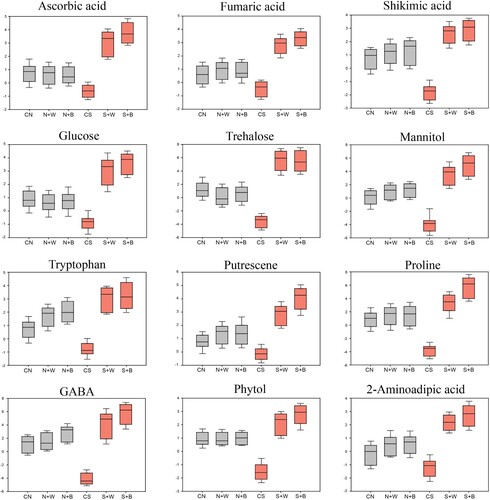
Sugars such as glucose, fructose, trehalose, sorbitol, glucose-6-phosphate and mannitol were sharply declined in salt-stressed plants compared with the unstressed control (). However, after the application of the AN-biostimulant to salt-stressed plants, the contents of glucose, trehalose, and mannitol were considerably increased in the S+B (4.41-folds, 7.21-folds, and 6.47-folds, respectively) followed by the S+W (3.87-folds, 7.21-folds, and 4.48-folds, respectively) treatment ( and ).
Amino acids such as putrescene, tyrosine, glutamine, and asparagine were unchanged in the CS condition, while tryptophan, proline, and GABA were remarkably decreased, in comparison to the CN control (). Interestingly, most of these amino acids were accumulated in large amounts in AN-biostimulant treated plants, such as putrescene, proline, GABA, and glycine in the S+W and S+B treatments, relative to the CS control ().
Similarly, other important metabolites such as phytol, 2-aminoadipic acid, adenosine-5-phosphate, and N-methylalanine markedly declined in salt-stressed plants compared to the unstressed control. However, phytol and 2-aminoadipic acid exhibited a sharp increase in both S+W and S+B treatments compared to the CS control ( and ).
3.7. Effect of salinity and AN-biostimulant on the expression of flavonoids pathway genes and total flavonoids content
Flavonoids are produced as secondary metabolites through the phenylpropanoid pathway (A), and play diverse biological functions in plants (Dong and Lin Citation2021). The transcript changes, both in early structural genes of phenylpropanoid pathway (i.e. OsPAL, OsC4H, Os4CL), and late genes (i.e. OsDFR, OsANS), were analyzed in control and AN-biostimulant treated plants in the non-stress and salt-stress conditions (). The transcripts of early pathway genes were slightly increased in salt-stressed plants as compared to the CN control (B). The expression of Os4CL was not different between the CS and S+W treatments, while remarkably higher in the S+B treatment as compared to the CN control (B). However, the expression levels of late pathway genes such as OsF´3H, OsDFR, and OsANS were significantly (p ≤ 0.05) lower in the CS plants in comparison to the CN control (A and B). The transcript of OsDFR was the lowest in the CS condition among all the other genes. The expression profile of these genes was markedly higher (p ≤ 0.05) in S+W and S+B treatments as compared to both the controls. Specifically, the transcripts of OsDFR and OsANS were only slightly increased in the S+W plants, while their expression levels were markedly triggered in the S+B treatment, compared to the respective CS control (B). Moreover, we also noticed a slight enhancement in the expression of these genes after the AN-biostimulant treatments under the non-stress condition (B).
Figure 8. Gene expression analysis of the flavonoid structural genes in control and AN-biostimulant treated rice plants under the non-stress and salinity stress conditions. (A) The flavonoid biosynthesis branch of the phenylpropanoid pathway. The transcripts of flavonoid structural genes highlighted with bold text have been confirmed in this study. (B) Heatmap analysis of the eight core flavonoids structural genes viz. PAL, C4H, 4CL, CHS, CHS, CHI, DFR, and ANS. (C) The total flavonoids (TFlav) content in control and treatment groups. The data is representative of three independent experiments. Data presented are the means ± SE (n = 4) and the significant difference between the means calculated at p ≤ 0.05 using the LSD test.
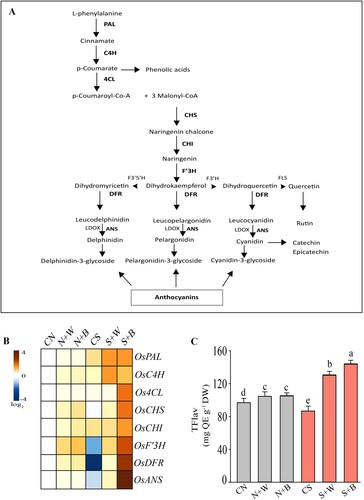
The expression of core phenylpropanoid pathway genes in control and AN-biostimulant plants was differentially regulated under non-stress and salt-stress conditions. Therefore, the effect on total flavonoids (TFlav) content in all the six treatment groups was further studied. Under the non-stress condition, the content of TFlav was slightly higher in AN-biostimulant plants relative to the CN control. In response to salt application, a significant decrease in TFlav was observed as compared to the CN control (C). On the other hand, a marked enhancement in TFlav content in the S+W (131.25 mg QE g−1 FW) and S+B (146.71 mg QE g−1 FW) treatments was recorded (C). Overall, the activation of early and late phenylpropanoid pathway genes and the enhancement of TFlav content in response to AN-biostimulant render the plants more tolerant, particularly in AN-biostimulant biweekly treatments, during salinity stress.
3.8. Pearson’s correlation analysis for growth, physiological and biochemical parameters
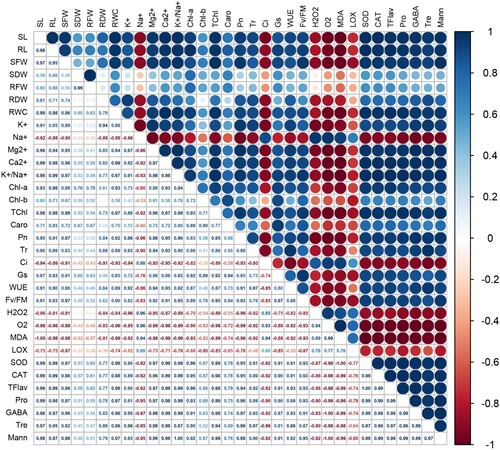
Pearson's correlations analysis was used to examine the relationship among all parameters of growth and physiology, antioxidant enzymes, and other selected biochemical markers (Tre; trehalose, Mann; mannitol, Pro; proline, and GABA; γ-aminobutyric acid), based on the main outcomes of AN-biostimulant treatments under the non-stress and salt stress conditions. Compared to the non-stress (non-saline) conditions, there were more strong and positive correlations between studied traits during the salt stress ( and ).
Figure 9. Pearson’s correlation analysis for all parameters of growth and physiology, antioxidant enzymes, and other selected biochemical markers (trehalose, mannitol, proline, and γ-aminobutyric acid) under non-stress condition. SL: shoot length; SFW: shoot fresh weight; SDW: shoot dry weight; RL: root length; RFW: root fresh weight; RDW: root dry weight; RWC: relative water content; K+: potassium; Na+: sodium; Mg2+: magnesium; Ca2+: calcium; K+/Na+: ratio of K+ and Na+; Chl-a: chlorophyll a; Chl-b: chlorophyll b; TChl: total chlorophyll; Caro: carotenoids; Pn: Net photosynthetic rate; Tr: transpiration rate; Ci: intercellular CO2; Gs: stomatal conductance; Fv/Fm: maximum efficiency of photosystem II; WUE: water use efficiency; H2O2: hydrogen peroxide; O2•−: superoxide anion; MDA: malondialdehyde; LOX: lipoxygenase activity; SOD: superoxide dismutase; CAT: catalase; TFlav: total flavonoids; Pro: proline; Tre: trehalose; Mann: mannitol; and GABA: γ-aminobutyric acid.
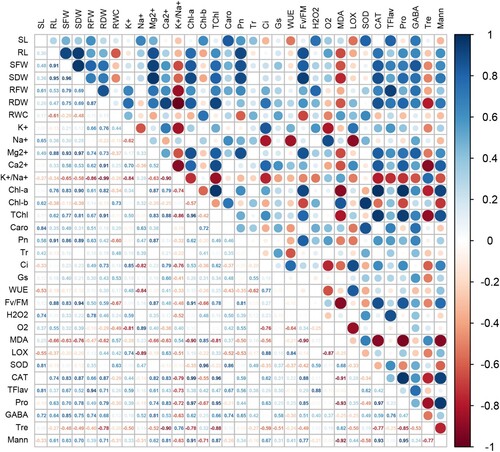
Figure 10. Pearson’s correlation analysis for all parameters of growth and physiology, antioxidant enzymes, and other selected biochemical markers (trehalose, mannitol, proline, and γ-aminobutyric acid) under the salt-stress condition. See details of parameters in figure 9.
In non-stress growth conditions, the growth traits (RL, SFW, SDW, RFW, and RDW) showed a significant (p ≤ 0.05) positive correlation with Chl-a, TChl, and Caro (, Supplementary Figure 1). There was a strong negative correlation between the MDA and growth parameters, such as RL ( – 0.66), SFW ( – 0.63), SDW ( – 0.76), RFW ( – 0.47), and RDW ( – 0.62). Moreover, MDA also showed a strong negative correlation with Chl-a ( – 0.90), TChl ( – 0.81), and Fv/Fm ( – 0.90). The trait RWC showed a significant negative correlation with RL, SDW, Pn, O2•−, and Fv/Fm. The Pn was positively correlated with most of the growth parameters, such as SL (0.58), RL (0.91), SFW (0.86), SDW (0.89), RFW (0.63), and RDW (0.42). However, Tr, Gs, and WUE did not show any significant correlation with most growth parameters during the normal condition. The mineral ions Mg2+ and Ca2+ showed a strong positive correlation with most of these growth parameters, however, the K+/Na+ ratio showed an obvious negative correlation with growth parameters during the non-stress condition. The SOD did not show any significant correlation with growth parameters, but CAT activity was strongly correlated with growth parameters under the non-stress condition (, Supplementary Figure 1). Other biochemical markers such as Pro, GABA, and Mann largely showed a positive correlation with growth parameters, but Tre showed a negative correlation with most parameters studied here under the non-stress condition (, Supplementary Figure 1).
During the salt stress condition, a strong positive correlation was recorded between the growth parameters and pigment contents (, Supplementary Figure 2). Similarly, the physiological traits (Pn, Tr, Gs, WUE, and Fv/Fm) showed a strong positive correlation with several growth parameters and pigment contents. Interestingly, Ci values showed a strong negative correlation with most of the growth and physiological traits studied here (). However, a strong positive correlation was noticed between the Ci and oxidative parameters (H2O2, O2•−, MDA and LOX activity). In general, these oxidative parameters showed a significant negative correlation with most of the traits studied here (). Intriguingly, a strong and positive correlation between antioxidant enzymes, growth parameters, pigment contents and several other physiological parameters, was recorded. However, the SOD and CAT activity was strongly and negatively correlated with all of the oxidative parameters studied here (, Supplementary Figure 2). In case of mineral ions, the Na+ content showed a strong negative correlation with several growth and physiological parameters, however, it showed a positive correlation with oxidative parameters. On the other hand, Mg2+, Ca2+, and K+/Na+ ratio showed a strong positive correlation with several growth and physiological parameters, however, they showed a negative correlation with oxidative parameters i.e. H2O2, O2•−, MDA and LOX activity (, Supplementary Figure 2). Other biochemical traits such as Pro, Tre, GABA, and Mann showed a positive correlation with several growth and physiological traits, including the SOD and CAT, however, these biochemical traits showed a strong negative correlation with oxidative parameters and the Na+ content, under the given salt stress condition (, Supplementary Figure 2).
3.9. Principal component analysis (PCA)
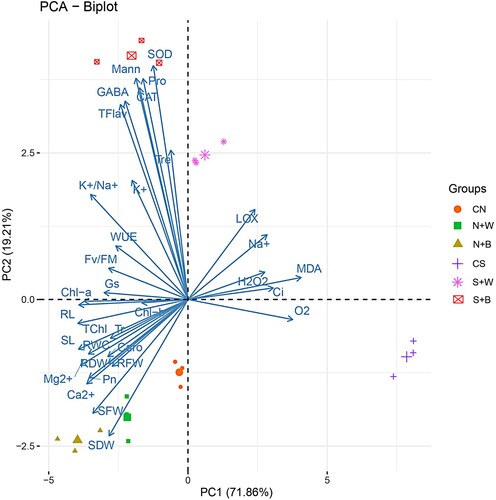
A PCA score plot was used to assess the responses of rice seedlings to AN-biostimulant treatments under the non-stress (non-saline) and salt stress conditions. In the combined data set, the PC1 and PC2 accounted for 91.07% of the overall data’s variability (including PC1 variance of 71.86% and PC2 variance of 19.21%) (). The results showed that the clusters of AN-biostimulant treatments under non-stress conditions were located separately from those under salt stress. Similarly, the biplot showed that the unstressed control had a separate cluster from the stressed control (located in different quadrants) (). The PC1 showed a strong positive association with MDA, LOX, Ci, H2O2, O2•−, and Na+ content, whereas antioxidant enzymes, non-enzymatic biochemical markers (including Tre, Mann, Pro, and GABA), and all the other traits showed a negative association in PC1 (). The oxidative stress parameters (MDA, LOX, H2O2), antioxidant enzymes (SOD and CAT), WUE, Gs, K+, K+/Na+, Fv/Fm, and non-enzymatic biochemical markers showed a positive association in PC2, while the pigment, growth parameters, Pn, RWC, and O2•− showed a negative association with PC2 (). In addition, the PCA results clearly showed that rice plants exhibited a similar pattern of plant physiological and biochemical responses based on weekly and biweekly AN-biostimulant treatments under non-stress conditions (located in similar quadrant). However, the effect of weekly and biweekly AN-biostimulant treatments during the salt stress correspond to several different responses, particularly in AN-biostimulant biweekly treatment (mainly due to K+/Na+, Fv/Fm, Gs, WUE, SOD, CAT, TFlav, and other important biochemical markers). Consistent with the correlation analysis (), the oxidative parameters, Na+ content, and Ci had negative correlations with other traits, as indicated by the obtuse angles between them ().
Figure 11. Principal component analysis (PCA) for all parameters of growth and physiology, antioxidant enzymes, and other selected biochemical markers (trehalose, mannitol, proline, and γ-aminobutyric acid) in the treatment groups. See details of parameters in figure 9.
4. Discussion
Salinity is becoming a pressing environmental issue worldwide as a result of excessive anthropogenic disturbances, urbanization and rapid negative climate change, posing one of the major threats to sustainable agricultural development and productivity (Singh Citation2022). To solve these issues, new agricultural solutions are needed to meet the rising need for sustainable agricultural output in the context of arable land scarcity and climate change. The Ascophyllum nodosum (AN), a brown alga, is high in carbohydrate (mainly polysaccharides), protein, lipids, and phenolic content, which makes it suitable to be widely used as a biostimulant (Battacharyya et al. Citation2015; Shukla et al. Citation2019). The potential role of an AN-biostimulant in salinity mitigation was investigated in this study. To this end, several parameters including plant morphology and biomass, photosynthetic indicators, ionic homeostasis, enzymatic and non-enzymatic antioxidant mechanisms were investigated in order to better understand how plants could respond with and without the AN-biostimulant treatments under the non-stress and severe salt stress (ECe up to 20.6 dSm−1) conditions.
The variability in soil and environment makes it challenging to screen rice for salinity in field conditions. To address this issue, IRRI (International Rice Research Institute) has adopted a standardized method that utilizes straightforward and consistent techniques to evaluate salinity in rice during the seedling stage to minimize the impact of environmental factors (Kakar et al. Citation2019). In the current study, rice seedling growth had been significantly reduced in response to salt stress by a considerable decline in shoot and root length, and biomass (). One of the major causes of plant biomass decline under salt stress is the inhibition and disruption of photosynthesis, which is primarily the reason for the growth impairment in plants by salinity. Our results showed a significant decrease in gas exchange parameters due to salt stress that include Pn, Tr, Gs, and WUE, however, the Ci increased in response to salt stress (). The negative correlation between the Gs and Ci generally indicates that the decline in Pn is due to non-stomatal limitations, as described by earlier studies (Ran et al. Citation2021; Yin et al. Citation2021). Interestingly, the gas exchange parameters including Pn, Tr, Gs, and WUE were positively accelerated, while the Ci was slightly decreased in AN-biostimulant treatments relative to salt stress control (). The relative low value of Ci in AN-biostimulant treated plants under salinity condition showed an adaptive mechanism of CO2 due to the biostimulant treatment to either change the diffusion concentration of photosynthetic machinery and/or turnover of the efficiency of photosynthetic capacity (Bazrafshan and Ehsanzadeh Citation2014). During stress conditions, the content of main plant photosynthetic pigments (chlorophylls and carotenoids) are commonly used as an indirect measure of the absorption, transformation, and transfer of light energy which ultimately reflect in changes of photosynthetic process in plants (Ramírez-Olvera et al. Citation2021). Plants subjected to AN-biostimulant treatments also showed an increment in the contents of chlorophyll a, chlorophyll b, total chlorophyll, and carotenoids under the salt stress conditions, in comparison to salt-only control (). This suggests that the capture and utilization of light energy by photosynthetic apparatus was promoted by AN-biostimulant treatment under the salinity stress condition (Sharma et al. Citation2020). The Chl-a, and Chl-b are important pigments for photosynthetic reaction in plants as they absorb sunlight at different wavelengths (Li et al. Citation2018), thus adjustments in the total chlorophyll content (Chl-a+Chl-b) could directly influence the photosynthetic capacity of plants under stress. The increase of chlorophyll and carotenoids content by AN-derived biostimulant under the salinity stress has also been reported in other important crops such as maize (D’Amato and Del Buono Citation2021). Further, the primary conversion efficiency of light energy in the PSII reaction center was assessed by measuring the maximum photochemical efficiency (Fv/Fm). The Fv/Fm was decreased in salt-only control, while the treatment of AN-biostimulant increased the Fv/Fm values during the salt stress, which is probably to avoid any damages caused by photoinhibition (Akhter et al. Citation2021), thus maintaining the photosynthetic capacity of rice plants. Several studies also showed a similar trend of growth and physiological stimulation by the foliar or root application of extract derived from the AN in response to different stress factors. For instance, the positive effect of foliar applied AN-biostimulant on shoot and root fresh and dry weight biomass was reported under potassium deficiency. This stimulatory effect of AN extract on lettuce plants was attributed to higher photosynthetic rate, total chlorophyll, and leaf fluorescence (Chrysargyris et al. Citation2018). Another study reported that the foliar treatments with AN improved photosynthesis and stomatal conductance during heat stress. Additionally, even during the hottest times, extract-treated Vitis vinifera vines were able to maintain Fv/Fm close to the ideal value (Salvi et al. Citation2019). Recently, a study demonstrated the enhancement of pigment contents (Chl-a, Chl-b, TChl, Caro), mineral ions, and Fv/Fm in lettuce plants alone or in combination with arbuscular mycorrhiza to improve growth and development (Asadi et al. Citation2022).
The photosynthetic efficiency and water content in the leaves of plants are also closely related. Salt stress drastically reduces the water availability and turgor both in shoots and roots that affect the overall water status of plants (Cocozza et al. Citation2013). A significant decline in RWC was recorded in salt-only control, while AN-biostimulant treatments enhanced the RWC level under the salt stress (). Similarly, under the salt stress, the WUE was higher in biostimulant treated plants than in the respective control (F). The positive effect on WUE could be associated with higher values of Gs, which maintain the osmotic potential under the salt stress due to AN-biostimulant application. These results implies that the AN-biostimulant treatment showed enhanced salt tolerance by a powerful mechanism for conserving cellular hydration and maintenance of a leaf turgor favorable for photosynthesis and growth (Cocozza et al. Citation2013).
Ions are crucial for plants’ normal growth, but salt stress (excess of salt ions, i.e. sodium and chloride ions) can alter the dynamic ion balance in plants and cause ion toxicity. Generally, plants respond to salinity in two way: first, they experience ‘osmotic stress’ which results from less water in the soil, and second, they experience ‘ionic stress’ which is brought on by higher levels of cytosolic sodium (Na+) and chloride (Cl-) in mature leaves (Basu et al. Citation2021). A crucial salt-tolerance mechanism in plant cells is the restoration of the ion homeostasis during salinity stress, since such ion toxicity systematicaly alters the availability of other important ions (Guo et al. Citation2020). In rice, excessive accumulation of Na+ disrupts the uptake of important macronutrients (K+, Ca2+, Mg2+) both at early and late growth stages as reported by other researchers (Akter and Oue Citation2018). The over – accumulation of Na+ ions during salt stress, especially in the above-ground parts of plants, interfere with K+ homeostasis that disturbs ionic channels associated with Na+ and K+ uptake and translocation (Assaha et al. Citation2017). In addition, K+ participates in the metabolism of various enzymes, and regulates hormonal and calcium signaling pathways (Che et al. Citation2022). The excessive loss of K+ due to salt stress decreases the activity of K+-dependent enzymes and signal transduction pathways (Che et al. Citation2022). This phenomena leads to substantial disruptions in some enzymatically mediated processes (e.g. carbon assimilation and reduction processes), and intracellular impairment of the ionic homoeostasis. Ultimately, other important physiological functions are changed such as leaf water potential, leaf turgor, and accumulation of intracellular osmotic solutes (osmolytes; sugars and amino acids) to meet the long-term energy demands in the cell (Garrote-Moreno et al. Citation2015). In general, a high K+/Na+ ratio is an important indicator of salt tolerance in plants that defines the optimization of cellular metabolism and physiology (Zelm et al. Citation2020). In the present study, a significant decrease in the K+/Na+ ratio in salt-stressed plants was observed as compared to unstressed control. On the other hand, a significant high K+/Na+ ratio in both the AN-biostimulant treatments (S+W and S+B) was recorded, which corresponds to high salinity tolerance in AN-biostimulant treated plants (Isayenkov and Maathuis Citation2019), relative to salt-only control (). Moreover, contents of other mineral nutrients (Mg2+ and Ca2+) were also enhanced in S+W and S+B treatments as compared to the respective control (). Consistent with these findings, other studies have also shown the positive impact of AN-biostimulant treatment on mineral contents (Głosek-Sobieraj et al. Citation2019; Kim et al. Citation2021). Likewise, a recent study demonstrated that two commercial AN-biostimulants, Rygex and Superfifity, significantly enhanced the macro – and micronutrients in tomato plants (Di Stasio et al. Citation2018). Previously, it has been shown that the AN-derived extract regulates key genes involved in the nitrate and sulfate uptake and assimilation in rapeseed (Jannin et al. Citation2013). Furthermore, root application of AN derived extract on spinach plants induced the expression of nitrate reductase, an important enzyme involved in nitrogen assimilation (Fan et al. Citation2013). The seaweed AN-derived biostimulant enhanced the nitrogen use efficiency in wheat plants by regulating multiple genes involved in N uptake, transport, and assimilation (Łangowski et al. Citation2022). Similarly, in a recent study, genes related to phosphorous homeostasis in Zea mays (ZmPHR1, ZmPHT1, ZmPTF1, ZmSPX1, and ZmSPX3), were upregulated by the use of AN-based biostimulant to improve growth under phosphorous limited conditions (Shukla and Prithiviraj Citation2021). Taken together, based on this evidence, it is likely that the treatment of AN-biostimulant retained better growth of rice plants under stress conditions by maintenance of water status, regulating genes related to nutrients uptake and assimilation, and a balance between K+ and Na+ ions as described in above studies.
Salinity stress typically causes a severe oxidative stress by the production of multiple reactive oxygen species (ROS) in different cell compartments, which greatly damage carbohydrates, proteins, lipids, and also nucleic acids such as DNA (Chele et al. Citation2021; Fujita and Hasanuzzaman Citation2022). The most common indicators for determining oxidative stress including O2•− and the H2O2 generation, MDA levels, and the activity of LOX were measured in this study. The results indicate that plants not supplemented with AN-biostimulant were under severe oxidative stress due to salinity, whereas the AN-biostimulant treated showed significantly enhanced salt tolerance by suppressing the production of these oxidative stressors (). To further understand the underlying molecular mechanisms involved in AN-biostimulant mediated redox status, measurement of antioxidant enzyme (SOD and CAT) activities and related gene expression analysis were also performed. The data indicated that the SOD and CAT activities were triggered due to the treatment of AN-biostimulant in stressed-plants (S+W and S+B treatments), while decreased in plants without the AN-biostimulant (CS plants) due to salinity stress (A and B). Overall, the relative gene expression of SOD (OsSOD1, OsSOD2, and OsSOD3) and CAT (OsCATa, OsCATb, and OsCATc) were significantly upregulated in S+B followed by S+W treatment, while decreased in stressed-plants without the AN-biostimulant treatment (). A positive impact of AN-biostimulant on the mitigation of ROS by enhancing the activities of antioxidant enzymes during salt stress has been reported in tomato (Di Stasio et al. Citation2018), passion fruit (Jolinda et al. Citation2018), avocado (Bonomelli et al. Citation2018) and pepper plants (Yildiztekin et al. Citation2018). However, a wide range of molecular re-adjustments are required in order to protect plants from oxidative damages. Plant hormones play very important role in defense signaling and regulation of ROS during salinity stress. Studies have shown that the bioactive compounds present in AN-based extracts work synergistically to reduce oxidative stress by inducing pathways associated with hormone biosynthesis (Omidbakhshfard et al. Citation2020). Several genes for hormone signaling (auxin and gibberellin) were induced during oxidative stress by the AN biostimulant (Omidbakhshfard et al. Citation2020), which provide a molecular explanation for hormone-mediated ROS scavenging and potentially protecting the plants from oxidative injuries. Other authors have also reported the involvement of several transcription factors that interact with downstream genes via cis-acting elements in their promoter regions, to regulate salt tolerance in different plants after the application of AN-based extracts (Goñi et al. Citation2018; Jithesh et al. Citation2019). Overall, these results suggest that the bioactive compounds in AN-derived extracts potentially enhanced the ROS detoxification pathways, transcriptional, and post-transcriptional processes to modulate cellular metabolism to effectively mitigate salt stress in rice plants.
Plant responses to abiotic stresses usually overlap primary and secondary metabolism. Primary metabolism pathways have been proposed to play important roles in salt stress relief thereby providing energy for stress-responsive metabolic systems, modulating signaling channels, and acting as precursors for the production of many secondary metabolites (Chele et al. Citation2021). The synthesis of thousands of secondary metabolites is produced from primary metabolites, which are derived from the tricarboxylic acid (TCA) cycle (organic acids – malic acid, succinic acid, citric acid), glycolysis (sugars), and the shikimate pathways (Bandehagh and Taylor Citation2020). In this study, plants subjected to salt stress showed the lowest levels of organic acids, while their accumulation was remarkably enhanced in weekly and biweekly biostimulant-treated plants ( and ). In general, many organic acids are engaged in the TCA cycle, which is the most important energy metabolic mechanism in plants that drives ATP generation and biosynthesis (Igamberdiev and Eprintsev Citation2016). The treatment of AN-biostimulant also resulted in a significant increase in the content of most of the sugars (such as glucose, fructose, and trehalose) and sugar alcohols (such as sorbitol and mannitol), implying that AN biostimulant-induced carbohydrate accumulation could be linked to increased photosynthetic efficiency and osmotic adjustment (Keunen et al. Citation2013), among other important physiological adaptation that contributed to salt tolerance. Previous studies also demonstrated that trehalose effectively alleviated salt stress by increasing the concentration of ABA and the expression of related genes in tomato plants (Feng et al. Citation2019). Another recent study reported that the increased level of sorbitol plays a significant role in protecting plants during salt stress by maintaining glucose and fructose levels (Mascellani et al. Citation2021).
Amino acids are another key primary metabolite in plants, serving as osmolytes, protein synthesis precursors, and secondary metabolites for stress resistance (Kumar et al. Citation2021; Shahzad et al. Citation2021b). The AN-biostimulant treatment during salt stress substantially boosted the amino acid metabolism, resulting in a large accumulation of tryptophan, putrescene, proline, and GABA ( and ). To protect plants from oxidation and ROS during salt stress, proline serves various critical roles including the reduction of ion toxicity and maintaining plant-water relations (de Freitas et al. Citation2019). Similarly, other researchers have reported the GABA's ability to improve salt tolerance in rice plants due to the induction of antioxidant enzymes, and secondary metabolites (Sheteiwy et al. Citation2019). Further, the synthesis of GABA is also involved in dissipation of excess energy and availability of more CO2 that allows the proper functioning of the Calvin cycle and decreases ROS generation and photodamage under oxidative stress conditions (Dell'Aversana et al. Citation2021). Our results are in agreement with a recent study, which shows that the AN-biostimulant protects Arabidopsis, tomato, and pepper plants from photosynthetic inhibition and oxidative stress by regulating the accumulation of amino acids and other stress-responsive metabolites (Staykov et al. Citation2021). Differential accumulation of metabolites including organic acids, sugars, amino acids, and others seems to be crucial to neutralize the harmful effects of salinity in plants. Overall, these results suggest that the treatment of AN-based biostimulant regulates various metabolic pathways associated with organic acids, sugars, amino acids and other metabolites (involving the GABA shunt and tricarboxylic acid cycle) during salt stress to maintain the metabolic homeostasis, particularly in AN-biostimulant biweekly treatment. Other studies also support our findings, demonstrating that AN-biostimulant supplementation reshapes plant metabolism, triggering organic acids, sugars, and amino acids, which serve as important osmolytes for protection in response to various environmental challenges (Nair et al. Citation2012; Goñi et al. Citation2016; Salvi et al. Citation2019; Shukla and Prithiviraj Citation2021).
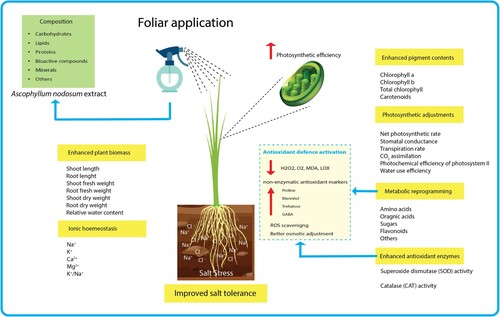
The flavonoids pathway is a well-known specialized metabolic pathway that plays an important role in plant responses to both abiotic and biotic stressors (Yu et al. Citation2020). In the present study, salt stress moderately increased the expression of early flavonoids pathway genes, while transcripts of late pathway genes were significantly decreased, compared to the unstressed control (B). In general, plants trigger stress-responsive genes in response to salinity. But, these reactions to salinity conditions, on the other hand, are extremely complicated and depend on the severity and duration of the stress, developmental stage, growth conditions, as well as the genotype of the plant under study (Chele et al. Citation2021). Intriguingly, in this study, we found that the biostimulant treatment has strongly upregulated the early and late genes of flavonoid biosynthetic pathway in salt-stressed seedlings, compared to those not treated with the biostimulant (B). Further, a significant increase in total flavonoids content was also noticed in salt-stressed plants treated with weekly and biweekly biostimulant (C). Noticeably, the upregulation of flavonoids biosynthetic genes often leads to higher accumulation of flavonoids content during stress conditions in different plant species as evidenced in several studies (Ma et al. Citation2014; Xu et al. Citation2020). These findings clearly show that the salt stress tolerance of rice plants due to biostimulant treatment might be closely related to the expression of flavonoid pathway genes and the accumulation of flavonoid compounds. Jithesh and colleagues found that the AN-biostimulant significantly influenced the expression of genes involved in the biosynthesis of flavonoids, which protect plants from ROS-induced oxidative damage during the salinity stress (Jithesh et al. Citation2019). Another recent study showed that the AN-biostimulant modulates the expression of genes involved in sugar, lipid, and secondary metabolism to reduce the oxidative damages under limited phosphorous conditions (Shukla and Prithiviraj Citation2021). Similarly, the elevation of total phenolic content and total flavonoids enhanced the antioxidant potential of Vigna radiata during salinity stress (Kumari et al. Citation2021). The correlation and PCA analysis also revealed a strong positive association of TFlav content and osmolytes (Pro, GABA, Mann, and Tre) with growth attributes, but negative association with all the oxidative parameters during the salt stress. In this study, the physiological, molecular, and cellular responses that contributed towards salt tolerance include: increased photosynthetic pigments, photosynthetic activity and efficiency, plant biomass, water use efficiency, ionic homeostasis, as well as enzymatic and non-enzymatic antioxidant potential (). Taken together, our results showed the effectiveness of AN-biostimulant treatment in rice plants by preventing and/or repairing damages caused by oxidative stress during salinity.
Figure 12. The schematic model depicting the role of foliar treatment of Ascophyllum nodosum biostimulant in improving salt tolerance of rice: Application of biostimulant improved rice salt tolerance by several physiological, molecular, and cellular responses that include: increased photosynthetic pigments, photosynthetic activity and efficiency, plant biomass, water use efficiency, ionic homeostasis, as well as enzymatic and non-enzymatic antioxidant potential.
5. Conclusion
Foliar treatment of the AN-based biostimulant minimizes the damaging effects of salinity in rice plants by enhancing seedling growth, mineral nutrient, and maintenance of photosynthetic activity and efficiency. The mitigation of the salinity was carried out by increasing antioxidant-related enzymes, and specifically regulating various metabolic pathways associated with organic acids, sugars, amino acids, as well as flavonoids, which protect plants from ROS-induced oxidative damage during the salt stress. Further, although both the AN-biostimulant treatments (weekly and biweekly) significantly improved rice tolerance to salt stress, however, the biweekly application of AN-biostimulant was more effective in terms of less oxidative damage with metabolically stronger plants. All together, these results revealed: (1) the use of the seaweed Ascophyllum nodosum based biostimulant causes a beneficial effect on plant growth and induces salinity tolerance in one of the most important crops, rice and (2), in the current challenging climatic scenario, AN-biostimulants could be widely and safely used as an eco-friendly approach to boost sustainable agricultural and horticultural production.
Supplemental Material
Download MS Word (31.6 KB)Supplemental Material
Download MS Word (3.1 MB)Acknowledgment
We would like to thank Professor Dr. Martin for his valuable suggestions to improve the manuscript. Authors are also thankful for the full financial support for APC provided by Universitas Padjadjaran.
Disclosure statement
No potential conflict of interest was reported by the author(s).
Data availability statement
The original contributions presented in this study are included in the article/supplementary material, further inquiries can be directed to the corresponding author.
Additional information
Funding
Notes on contributors
Raheel Shahzad
Raheel Shahzad, Postdoctoral Fellow at Universitas Padjadjaran. His work focuses on physiological, cellular and molecular mechanisms of plant adaptations to various environmental stress factors.
Putri Widyanti Harlina
Putri Widyanti Harlina, Assistant Professor at Department of Food Technology, Universitas Padjadjaran. She focuses on lipidomics and antioxidation functions in foods.
Pedro P. Gallego
Pedro P. Gallego, Full Professor at Department of Plant Biology and Soil Science, Faculty of Biology, University of Vigo, Vigo, Spain. He focuses on plant biotechnology and physiology of woody plants, particularly with economic importance.
Jaume Flexas
Jaume Flexas, Full Professor of Plant Biology and Physiology at Universitat de les Illes Balears (UIB), Illes Balears, Spain.
Mohamed Ewas
Mohamed Ewas, Senior Researcher at Department of Genetic Resources, Desert Research Center Cairo, Egypt. His work focuses on molecular and genetic mechanisms of stress tolerance in plants.
Xiang Leiwen
Xiang Leiwen, Full Professor at Fuzhou Cereal Food Industry Technology Innovation Center, Fujian Polytechnic Normal University, Fuqing, P.R. China.
Agung Karuniawan
Agung Karuniawan, Full Professor at Faculty of Agriculture, Universitas Padjadjaran. His expertise is in plant genetic resources/breeding, focuses on grain, legume and tuber crops.
References
- Akhter MS, Noreen S, Mahmood S, Athar HU, Ashraf M, Alsahli AA, Ahmad P. 2021. Influence of salinity stress on PSII in barley (Hordeum vulgare L.) genotypes, probed by chlorophyll-a fluorescence. Journal of King Saud University - Science. 33:101239. doi:10.1016/j.jksus.2020.101239.
- Akter M, Oue H. 2018. Effect of saline irrigation on accumulation of Na+, K+, Ca2+, and Mg2+ ions in rice plants. Agriculture. 8(10):164. doi:10.3390/agriculture8100164.
- Ali O, Ramsubhag A, Farrell AD, Jayaraman J. 2022. Foliar application of seaweed extracts influences the phytomicrobiome dynamics in tomato and sweet pepper plants. J Appl Phycol. 34:3219–3235. doi:10.1007/s10811-022-02823-x.
- Arnon DI. 1949. A copper enzymes in isolated chloroplasts. Polyphenoloxidase in Beta Vulgaris. Plant Physiol. 24:1–15. doi:10.1104/pp.24.1.1.
- Asadi M, Rasouli F, Amini T, Hassanpouraghdam MB, Souri S, Skrovankova S, Mlcek J, Ercisli S. 2022. Improvement of photosynthetic pigment characteristics, mineral content, and antioxidant activity of lettuce (Lactuca sativa L.) by arbuscular mycorrhizal fungus and seaweed extract foliar application. Agronomy. 12(8):1943. doi:10.3390/agronomy12081943.
- Assaha DVM, Ueda A, Saneoka H, Al-Yahyai R, Yaish MW. 2017. The role of Na+ and K+ transporters in salt stress adaptation in glycophytes. Front Physiol. 8:509. doi:10.3389/fphys.2017.00509.
- Baltazar M, Correia S, Guinan KJ, Sujeeth N, Bragança R, Gonçalves B. 2021. Recent advances in the molecular effects of biostimulants in plants: an overview. Biomolecules. 11:1096–1027. doi:10.3390/biom11081096.
- Bandehagh A, Taylor NL. 2020. Can alternative metabolic pathways and shunts overcome salinity induced inhibition of central carbon metabolism in crops? Front Plant Sci. 11:1072. doi:10.3389/fpls.2020.01072.
- Basu S, Kumar A, Benazir I, Kumar G. 2021. Reassessing the role of ion homeostasis for improving salinity tolerance in crop plants. Physiol Plant. 171:502–519. doi:10.1111/ppl.13112.
- Battacharyya D, Babgohari MZ, Rathor P, Prithiviraj B. 2015. Seaweed extracts as biostimulants in horticulture. Sci Hortic. 196:39–48. doi:10.1016/j.scienta.2015.09.012.
- Bazrafshan AH, Ehsanzadeh PJP. 2014. Growth, photosynthesis and ion balance of sesame (Sesamum indicum L.) genotypes in response to NaCl concentration in hydroponic solutions. Photosynthetica. 52:134–147. doi:10.1007/s11099-014-0015-z.
- Bonomelli C, Celis V, Lombardi G, Mártiz J. 2018. Salt stress effects on avocado (Persea americana Mill.) plants with and without seaweed extract (Ascophyllum nodosum) application. Agronomy. 8:64. doi:10.3390/agronomy8050064.
- Carmody N, Goñi O, Łangowski Ł, O’Connell S. 2020. Ascophyllum nodosum extract biostimulant processing and its impact on enhancing heat stress tolerance during tomato fruit set. Front Plant Sci. 11:807. doi:10.3389/fpls.2020.00807.
- Chandrasekaran M, Chanratana M, Kim K, Seshadri S, Sa T. 2019. Impact of arbuscular mycorrhizal fungi on photosynthesis, water status, and gas exchange of plants under salt stress–a meta-analysis. Front Plant Sci. 10:457. doi:10.3389/fpls.2019.00457.
- Chaves MM, Flexas J, Pinheiro C. 2009. Photosynthesis under drought and salt stress: regulation mechanisms from whole plant to cell. Ann Bot. 103(4):551–560. doi:10.1093/aob/mcn125.
- Che Y, Yao T, Wang H, Wang Z, Zhang H, Sun G, Zhang H. 2022. Potassium ion regulates hormone, Ca2+ and H2O2 signal transduction and antioxidant activities to improve salt stress resistance in tobacco. Plant Physiol Biochem. 186:40–51. doi:10.1016/j.plaphy.2022.06.027.
- Chele KH, Tinte MM, Piater LA, Dubery IA, Tugizimana F. 2021. Soil salinity, a serious environmental issue and plant responses: a metabolomics perspective. Metabolites. 11:724. doi:10.3390/metabo11110724.
- Chouliaras V, Tasioula M, Chatzissavvidis C, Therios I, Tsabolatidou E. 2009. The effects of a seaweed extract in addition to nitrogen and boron fertilization on productivity, fruit maturation, leaf nutritional status and oil quality of the olive (Olea europaeaL.) cultivar Koroneiki. J Sci Food Agric. 89:984–988. doi:10.1002/jsfa.3543.
- Chrysargyris A, Xylia P, Anastasiou M, Pantelides I, Tzortzakis N. 2018. Effects of Ascophyllum nodosum seaweed extracts on lettuce growth, physiology and fresh-cut salad storage under potassium deficiency. J Sci Food Agric. 98:5861–5872. doi:10.1002/jsfa.9139.
- Cocozza C, Pulvento C, Lavini A, Riccardi M, d’Andria R, Tognetti R. 2013. Effects of increasing salinity stress and decreasing water availability on ecophysiological traits of quinoa (Chenopodium quinoaWilld.) grown in a mediterranean-type agroecosystem. J Agron Crop Sci. 199:229–240. doi:10.1111/jac.12012.
- D’Amato R, Del Buono D. 2021. Use of a biostimulant to mitigate salt stress in maize plants. Agronomy. 11:1755. doi:10.3390/agronomy11091755.
- de Freitas PAF, de Carvalho HH, Costa JH, Miranda RS, Saraiva K, de Oliveira FDB, Coelho DG, Prisco JT, Gomes-Filho E. 2019. Salt acclimation in sorghum plants by exogenous proline: physiological and biochemical changes and regulation of proline metabolism. Plant Cell Rep. 38:403–416. doi:10.1007/s00299-019-02382-5.
- Dell'Aversana E, Cirillo V, Van Oosten MJ, Di Stasio E, Saiano K, Woodrow P, Ciarmiello LF, Maggio A, Carillo P. 2021. Ascophyllum nodosum based extracts counteract salinity stress in tomato by remodeling leaf nitrogen metabolism. Plants. 10(6):1044. doi:10.3390/plants10061044.
- Di Stasio E, Van Oosten MJ, Silletti S, Raimondi G, dell’Aversana E, Carillo P, Maggio A. 2018. Ascophyllum nodosum-based algal extracts act as enhancers of growth, fruit quality, and adaptation to stress in salinized tomato plants. J Appl Phycol. 30:2675–2686. doi:10.1007/s10811-018-1439-9.
- Doderer A, Kokkelink I, van der Veen S, Valk BE, Schram AW, Douma AC. 1992. Purification and characterization of two lipoxygenase isoenzymes from germinating barley. Biochimica et Biophysica Acta (BBA) - Protein Structure and Molecular Enzymology. 1120:97–104. doi:10.1016/0167-4838(92)90429-H.
- Dong NQ, Lin HX. 2021. Contribution of phenylpropanoid metabolism to plant development and plant–environment interactions. J Integr Plant Biol. 63:180–209. doi:10.1111/jipb.13054.
- Dumanović J, Nepovimova E, Natić M, Kuča K, Jaćević V. 2021. The significance of reactive oxygen species and antioxidant defense system in plants: a concise overview. Front Plant Sci. 11:552969. doi:10.3389/fpls.2020.552969.
- Eckerstorfer MF, Engelhard M, Heissenberger A, Simon S, Teichmann H. 2019. Plants developed by New genetic modification techniques—comparison of existing regulatory frameworks in the EU and Non-EU countries. Front Bioeng Biotechnol. 7:26. doi:10.3389/fbioe.2019.00026.
- Fan D, Mark Hodges D, Critchley AT, Prithiviraj B. 2013. A commercial extract of brown macroalga (Ascophyllum nodosum) affects yield and the nutritional quality of Spinach in vitro. Commun Soil Sci Plant Anal. 44(12):1873–1884. doi:10.1080/00103624.2013.790404.
- Feng Y, Chen X, He Y, Kou X, Xue Z. 2019. Effects of exogenous trehalose on the metabolism of sugar and abscisic acid in tomato seedlings under salt stress. Transactions of Tianjin University. 25:451–471. doi:10.1007/s12209-019-00214-x.
- Flexas J, Bota J, Loreto F, Cornic G, Sharkey TD. 2004. Diffusive and metabolic limitations to photosynthesis under drought and salinity in C3Plants. Plant Biology. 6(03):269–279. doi:10.1055/s-2004-820867.
- Franzoni G, Cocetta G, Prinsi B, Ferrante A, Espen L. 2022. Biostimulants on crops: their impact under abiotic stress conditions. Horticulturae. 8(3):189. doi:10.3390/horticulturae8030189.
- Fujita M, Hasanuzzaman M. 2022. Approaches to enhancing antioxidant defense in plants. Antioxidants. 11(5):925. doi:10.3390/antiox11050925.
- Garrote-Moreno A, Sandoval-Gil JM, Ruiz JM, Marín-Guirao L, Bernardeau-Esteller J, Muñoz RG, Sánchez-Lizaso JL. 2015. Plant water relations and ion homoeostasis of Mediterranean seagrasses (Posidonia oceanica and Cymodocea nodosa) in response to hypersaline stress. Mar Biol. 162:55–68. doi:10.1007/s00227-014-2565-9.
- Głosek-Sobieraj M, Cwalina-Ambroziak B, Wierzbowska J, Waśkiewicz A. 2019. The influence of biostimulants on the contentof P, K, Ca, Mg, and Na in the skin and fleshof potato tubers. Pol J Environ Stud. 28:1693–1700. doi:10.15244/pjoes/87060.
- Goñi O, Fort A, Quille P, McKeown PC, Spillane C, O’Connell S. 2016. Comparative transcriptome analysis of two Ascophyllum nodosum extract biostimulants: same seaweed but different. J Agric Food Chem. 64:2980–2989. doi:10.1021/acs.jafc.6b00621.
- Goñi O, Quille P, O'Connell S. 2018. Ascophyllum nodosum extract biostimulants and their role in enhancing tolerance to drought stress in tomato plants. Plant Physiol Biochem. 126:63–73. doi:10.1016/j.plaphy.2018.02.024.
- Gunupuru LR, Patel JS, Sumarah MW, Renaud JB, Mantin EG, Prithiviraj B. 2019. A plant biostimulant made from the marine brown algae Ascophyllum nodosum and chitosan reduce Fusarium head blight and mycotoxin contamination in wheat. PLoS One. 14:e0220562. doi:10.1371/journal.pone.0220562.
- Guo H, Huang Z, Li M, Hou Z. 2020. Growth, ionic homeostasis, and physiological responses of cotton under different salt and alkali stresses. Sci Rep. 10:21844. doi:10.1038/s41598-020-79045-z.
- Hatfield JL, Dold C. 2019. Water-use efficiency: advances and challenges in a changing climate. Front Plant Sci. 10:103. doi:10.3389/fpls.2019.00103.
- Hnilickova H, Kraus K, Vachova P, Hnilicka F. 2021. Salinity stress affects photosynthesis, malondialdehyde formation, and proline content in Portulaca oleracea L. Plants. 10:845. doi:10.3390/plants10050845.
- Hoang TML, Tran TN, Nguyen TKT, Williams B, Wurm P, Bellairs S, et al. 2016. Improvement of salinity stress tolerance in rice: challenges and opportunities. Agronomy. 6:54.
- Hossain MS, Li J, Sikdar A, Hasanuzzaman M, Uzizerimana F, Muhammad I, Yuan Y, Zhang C, Wang C, Feng B. 2020. Exogenous melatonin modulates the physiological and biochemical mechanisms of drought tolerance in tartary buckwheat (Fagopyrum tataricum (L.) Gaertn). Molecules. 25(12):2828. doi:10.3390/molecules25122828.
- Igamberdiev AU, Eprintsev AT. 2016. Organic acids: the pools of fixed carbon involved in redox regulation and energy balance in higher plants. Front Plant Sci. 7:1042. doi:10.3389/fpls.2016.01042.
- Isayenkov SV, Maathuis FJM. 2019. Plant salinity stress: many unanswered questions remain. Front Plant Sci. 10:80. doi:10.3389/fpls.2019.00080.
- Jannin L, Arkoun M, Etienne P, Laîné P, Goux D, Garnica M, Fuentes M, Francisco SS, Baigorri R, Cruz F, et al. 2013. Brassica napus growth is promoted by Ascophyllum nodosum (L.) Le Jol. seaweed extract: microarray analysis and physiological characterization of N, C, and S metabolisms. J Plant Growth Regul. 32:31–52. doi:10.1007/s00344-012-9273-9.
- Jithesh MN, Shukla PS, Kant P, Joshi J, Critchley AT, Prithiviraj B. 2019. Physiological and transcriptomics analyses reveal that Ascophyllum nodosum extracts induce salinity tolerance in arabidopsis by regulating the expression of stress responsive genes. J Plant Growth Regul. 38:463–478. doi:10.1007/s00344-018-9861-4.
- Jolinda M, Leitão ET, Gomes CD, Rodrigues MH, Valéria FDO, dos Santos GL, et al. 2018. The initial growth of passion fruit plant irrigated with saline water and the application of biostimulants. J Agric Sci. 10:357–363.
- Kakar N, Jumaa SH, Redona ED, Warburton ML, Reddy KR. 2019. Evaluating rice for salinity using pot-culture provides a systematic tolerance assessment at the seedling stage. Rice. 12:57. doi:10.1186/s12284-019-0317-7.
- Keunen E, Peshev D, Vangronsveld J, Van Den Ende W, Cuypers A. 2013. Plant sugars are crucial players in the oxidative challenge during abiotic stress: extending the traditional concept. Plant Cell Environ. 36:1242–1255. doi:10.1111/pce.12061.
- Khataar M, Mohammadi MH, Shabani F. 2018. Author correction: soil salinity and matric potential interaction on water use, water use efficiency and yield response factor of bean and wheat. Sci Rep. 8:13280. doi:10.1038/s41598-018-31452-z.
- Kim BM, Lee HJ, Song YH, Kim HJ. 2021. Effect of salt stress on the growth, mineral contents, and metabolite profiles of spinach. J Sci Food Agric. 101:3787–3794. doi:10.1002/jsfa.11011.
- Kumar M, Patel KM, Kumar N, Bajpai AB, Siddique KHM. 2021. Metabolomics and molecular approaches reveal drought stress tolerance in plants. Int J Mol Sci. 22:9108. doi:10.3390/ijms22179108.
- Kumari S, Phogat D, Sehrawat KD, Choudhary R, Rajput VD, Ahlawat J, Karunakaran R, Minkina T, Sehrawat AR. 2021. The effect of Ascophyllum nodosum extract on the nutraceutical antioxidant potential of vigna radiata sprout under salt stress. Plants. 10(6):1216. doi:10.3390/plants10061216.
- Lan T, Zheng Y, Su Z, Yu S, Song H, Zheng X, Lin G, Wu W. 2019. OsSPL10, a SBP-Box gene, plays a dual role in salt tolerance and trichome formation in rice (Oryza sativaL.). G3 Genes|Genomes|Genetics. 9:4107–4114. doi:10.1534/g3.119.400700.
- Łangowski Ł, Goñi O, Ikuyinminu E, Feeney E, O’Connell S. 2022. Investigation of the direct effect of a precision Ascophyllum nodosum biostimulant on nitrogen use efficiency in wheat seedlings. Plant Physiol Biochem. 179:44–57. doi:10.1016/j.plaphy.2022.03.006.
- Li Y, He N, Hou J, Xu L, Liu C, Zhang J, Wang Q, Zhang X, Wu X. 2018. Factors influencing leaf chlorophyll content in natural forests at the biome scale. Front Ecol Evol. 6:64. doi:10.3389/fevo.2018.00064.
- Livak KJ, Schmittgen TD. 2001. Analysis of relative gene expression data using real-time quantitative PCR and the 2−ΔΔCT method. Methods. 25:402–408. doi:10.1006/meth.2001.1262.
- Ma D, Sun D, Wang C, Li Y, Guo T. 2014. Expression of flavonoid biosynthesis genes and accumulation of flavonoid in wheat leaves in response to drought stress. Plant Physiol Biochem. 80:60–66. doi:10.1016/j.plaphy.2014.03.024.
- Mascellani A, Natali L, Cavallini A, Mascagni F, Caruso G, Gucci R, Havlik J, Bernardi R. 2021. Moderate salinity stress affects expression of main sugar metabolism and transport genes and soluble carbohydrate content in ripe fig fruits (Ficus carica L. cv. Dottato). Plants. 10:1861. doi:10.3390/plants10091861.
- Mazhar S, Pellegrini E, Contin M, Bravo C, De Nobili M. 2022. Impacts of salinization caused by sea level rise on the biological processes of coastal soils - A review. Front Plant Sci. 10:909415.
- Mohanavelu A, Naganna SR, Al-Ansari N. 2021. Irrigation induced salinity and sodicity hazards on soil and groundwater: an overview of its causes, impacts and mitigation strategies. Agriculture. 11:983. doi:10.3390/agriculture11100983.
- Mousavi S, Regni L, Bocchini M, Mariotti R, Cultrera NGM, Mancuso S, Googlani J, Chakerolhosseini MR, Guerrero C, Albertini E, et al. 2019. Physiological, epigenetic and genetic regulation in some olive cultivars under salt stress. Sci Rep. 9:1093. doi:10.1038/s41598-018-37496-5.
- Munns R. 2002. Comparative physiology of salt and water stress. Plant Cell Environ. 25(2):239–250. doi:10.1046/j.0016-8025.2001.00808.x.
- Nair P, Kandasamy S, Zhang J, Ji X, Kirby C, Benkel B, Hodges MD, Critchley AT, Hiltz D, Prithiviraj B. 2012. Transcriptional and metabolomic analysis of Ascophyllum nodosum mediated freezing tolerance in Arabidopsis thaliana. BMC Genomics. 13:643. doi:10.1186/1471-2164-13-643.
- Omidbakhshfard MA, Sujeeth N, Gupta S, Omranian N, Guinan KJ, Brotman Y, Nikoloski Z, Fernie AR, Mueller-Roeber B, Gechev TS. 2020. A biostimulant obtained from the seaweed Ascophyllum nodosum protects Arabidopsis thaliana from severe oxidative stress. Int J Mol Sci. 21(2):474. doi:10.3390/ijms21020474.
- Plett DC, Ranathunge K, Melino VJ, Kuya N, Uga Y, Kronzucker HJ. 2020. The intersection of nitrogen nutrition and water use in plants: new paths toward improved crop productivity. J Exp Bot. 71:4452–4468. doi:10.1093/jxb/eraa049.
- Ramírez-Olvera SM, Trejo-Téllez LI, Gómez-Merino FC, Ruíz-Posadas LM, Alcántar-González EG, Saucedo-Veloz C. 2021. Silicon stimulates plant growth and metabolism in rice plants under conventional and osmotic stress conditions. Plants. 10:777. doi:10.3390/plants10040777.
- Ran X, Wang X, Gao X, Liang H, Liu B, Huang X. 2021. Effects of salt stress on the photosynthetic physiology and mineral ion absorption and distribution in white willow (Salix alba L.). PLoS One. 16(11):e0260086.
- Rao KVM, Sresty TVS. 2000. Antioxidative parameters in the seedlings of pigeonpea (Cajanus cajan (L.) Millspaugh) in response to Zn and Ni stresses. Plant Sci. 157:113–128. doi:10.1016/S0168-9452(00)00273-9.
- Raza A, Tabassum J, Fakhar AZ, Sharif R, Chen H, Zhang C, Ju L, Fotopoulos V, Siddique KHM, Singh RK, et al. 2022. Smart reprograming of plants against salinity stress using modern biotechnological tools. Crit Rev Biotechnol. 15:1–28. doi:10.1080/07388551.2022.2093695.
- Rouphael Y, Colla G. 2020. Toward a sustainable agriculture through plant biostimulants: from experimental data to practical applications. Agronomy. 10:1461. doi:10.3390/agronomy10101461.
- Sachdev S, Ansari SA, Ansari MI, Fujita M, Hasanuzzaman M. 2021. Abiotic stress and reactive oxygen species: generation, signaling, and defense mechanisms. Antioxidants. 10:277. doi:10.3390/antiox10020277.
- Salvi L, Brunetti C, Cataldo E, Niccolai A, Centritto M, Ferrini F, Mattii GB. 2019. Effects of Ascophyllum nodosum extract on Vitis vinifera: consequences on plant physiology, grape quality and secondary metabolism. Plant Physiol Biochem. 139:21–32. doi:10.1016/j.plaphy.2019.03.002.
- Sarker U, Oba S. 2018. Catalase, superoxide dismutase and ascorbate-glutathione cycle enzymes confer drought tolerance of Amaranthus tricolor. Sci Rep. 8:16496. doi:10.1038/s41598-018-34944-0.
- Shahzad R, Ewas M, Harlina PW, Khan SU, Zhenyuan P, Nie X, Nishawy E. 2021b. β-Sitosterol differentially regulates key metabolites for growth improvement and stress tolerance in rice plants during prolonged UV-B stress. Journal of Genetic Engineering and Biotechnology. 19:79. doi:10.1186/s43141-021-00183-6.
- Shahzad R, Harlina PW, Ewas M, Zhenyuan P, Nie X, Gallego PP, Ullah Khan S, Nishawy E, Khan AH, Jia H. 2021a. Foliar applied 24-epibrassinolide alleviates salt stress in rice (Oryza sativaL.) by suppression of ABA levels and upregulation of secondary metabolites. Journal of Plant Interactions. 16:533–549. doi:10.1080/17429145.2021.2002444.
- Sharma A, Kumar V, Shahzad B, Ramakrishnan M, Singh Sidhu GP, Bali AS, Handa N, Kapoor D, Yadav P, Khanna K, et al. 2020. Photosynthetic response of plants under different abiotic stresses: a review. J Plant Growth Regul. 39:509–531. doi:10.1007/s00344-019-10018-x.
- Sheteiwy MS, Shao H, Qi W, Hamoud YA, Shaghaleh H, Khan NU, Yang R, Tang B. 2019. GABA-alleviated oxidative injury induced by salinity, osmotic stress and their combination by regulating cellular and molecular signals in rice. Int J Mol Sci. 20:5709. doi:10.3390/ijms20225709.
- Shi-chu L, Yong J, Ma-bo L, Zhu W-X, Nan X, Hui-hui Z. 2019. Improving plant growth and alleviating photosynthetic inhibition from salt stress using AMF in alfalfa seedlings. Journal of Plant Interactions. 14:482–491. doi:10.1080/17429145.2019.1662101.
- Shin YK, Bhandari SR, Jo JS, Song JW, Cho MC, Yang EY, Lee JG. 2020. Response to salt stress in lettuce: changes in chlorophyll fluorescence parameters, phytochemical contents, and antioxidant activities. Agronomy. 10:1627. doi:10.3390/agronomy10111627.
- Shrivastava P, Kumar R. 2015. Soil salinity: a serious environmental issue and plant growth promoting bacteria as one of the tools for its alleviation. Saudi J Biol Sci. 22:123–131. doi:10.1016/j.sjbs.2014.12.001.
- Shukla PS, Mantin EG, Adil M, Bajpai S, Critchley AT, Prithiviraj B. 2019. Ascophyllum nodosum-based biostimulants: sustainable applications in agriculture for the stimulation of plant growth, stress tolerance, and disease management. Front Plant Sci. 10:655. doi:10.3389/fpls.2019.00655.
- Shukla PS, Prithiviraj B. 2021. Ascophyllum nodosum biostimulant improves the growth of zea mays grown under phosphorus impoverished conditions. Front Plant Sci. 11:601843. doi:10.3389/fpls.2020.601843.
- Singh A. 2022. Soil salinity: A global threat to sustainable development. Soil Use Manag. 38:39–67. doi:10.1111/sum.12772.
- Soltabayeva A, Ongaltay A, Omondi JO, Srivastava S. 2021. Morphological, physiological and molecular markers for salt-stressed plants. Plants. 10:243. doi:10.3390/plants10020243.
- Staykov NS, Angelov M, Petrov V, Minkov P, Kanojia A, Guinan KJ, Alseekh S, Fernie AR, Sujeeth N, Gechev TS. 2021. An Ascophyllum nodosum-derived biostimulant protects model and crop plants from oxidative stress. Metabolites. 11:24. doi:10.3390/metabo11010024.
- Sulochana SB, Arumugam M. 2020. Targeted metabolomic and biochemical changes during nitrogen stress mediated lipid accumulation in scenedesmus quadricauda CASA CC202. Front Bioeng Biotechnol. 8:585632. doi:10.3389/fbioe.2020.585632.
- Thu TTP, Yasui H, Yamakawa T. 2017. Effects of salt stress on plant growth characteristics and mineral content in diverse rice genotypes. Soil Sci Plant Nutr. 63:264–273.
- Velikova V, Yordanov I, Edreva A. 2000. Oxidative stress and some antioxidant systems in acid rain-treated bean plants. Plant Sci. 151:59–66. doi:10.1016/S0168-9452(99)00197-1.
- Vuorinen I, Hänninen J, Rajasilta M, Laine P, Eklund J, Montesino-Pouzols F, Corona F, Junker K, Meier HEM, Dippner JW. 2015. Scenario simulations of future salinity and ecological consequences in the Baltic Sea and adjacent North Sea areas–implications for environmental monitoring. Ecol Indic. 50:196–205. doi:10.1016/j.ecolind.2014.10.019.
- West JS, Townsend JA, Stevens M, Fitt BD. 2012. Comparative biology of different plant pathogens to estimate effects of climate change on crop diseases in Europe. Eur J Plant Pathol. 133(1):315–331. doi:10.1007/s10658-011-9932-x.
- Xu N, Liu S, Lu Z, Pang S, Wang L, Wang L, Li W. 2020. Gene expression profiles and flavonoid accumulation during salt stress in ginkgo biloba seedlings. Plants. 9:1162. doi:10.3390/plants9091162.
- Xu W, Dou Y, Geng H, Fu J, Dan Z, Liang T, Cheng M, Zhao W, Zeng Y, Hu Z, Huang W. 2022. OsGRP3 enhances drought resistance by altering phenylpropanoid biosynthesis pathway in rice (Oryza sativa L.). Int J Mol Sci. 23(13):7045. doi:10.3390/ijms23137045.
- Yildiztekin M, Tuna AL, Kaya C. 2018. Physiological effects of the brown seaweedAscophyllum nodosum)and humic substances on plant growth, enzyme activities of certain pepper plants grown under salt stress. Acta Biol Hung. 69:325–335. doi:10.1556/018.68.2018.3.8.
- Yin F, Zhang S, Cao B, Xu K. 2021. Low pH alleviated salinity stress of ginger seedlings by enhancing photosynthesis, fluorescence, and mineral element contents. PeerJ. 9:e10832. doi:10.7717/peerj.10832.
- Yu A, Zhao J, Wang Z, Cheng K, Zhang P, Tian G, Liu X, Guo E, Du Y, Wang Y. 2020. Transcriptome and metabolite analysis reveal the drought tolerance of foxtail millet significantly correlated with phenylpropanoids-related pathways during germination process under PEG stress. BMC Plant Biol. 20:274. doi:10.1186/s12870-020-02483-4.
- Yu S, Yang F, Zou Y, Yang Y, Li T, Chen S, Wang Y, Xu K, Xia H, Luo L. 2022. Overexpressing PpBURP2 in rice increases plant defense to abiotic stress and bacterial leaf blight. Front Plant Sci. 13:812279. doi:10.3389/fpls.2022.812279.
- Zelm E, Zhang Y, Testerink C. 2020. Salt tolerance mechanisms of plants. Annu Rev Plant Biol. 71:403–433. doi:10.1146/annurev-arplant-050718-100005.