Abstract
The cryoprotective effects of lactitol, maltodextrin, palatinit, polydextrose, trehalose on the protein denaturation of threadfin bream surimi during six months of frozen storage were investigated. The characteristics analyzed were Ca2+-ATPase activity, protein solubility, sulfhydryl (SH) content, electrophoresis, surface morphology, and thermal stability. The effectiveness of all cryoprotectants generally decreased as the storage time increased. Polydextrose was able to maintain Ca2+-ATPase activity, protein solubility, and SH content of 33.5%, 71.3%, 71.8%, respectively. Sucrose was able to maintain Ca2+-ATPase activity, protein solubility, and SH content of 32.4%, 68.1%, 75.6%, respectively. Electrophoresis showed that the myosin heavy chain (MHC) and actin band intensity almost disappeared by the end of storage. Analysis by scanning electron microscopy (SEM) demonstrated that the number of pores formed increased after storage. Thermal stability analysis showed a decrease in myosin but no significant change in actin content. This study suggests that polydextrose as a cryoprotectant is able to maintain protein from denaturation as the same as sucrose.
Se estudiaron los efectos crioprotectores de lactitol, maltodextrina, palatinita, polidextrosa, trehalosa en la desnaturalización de proteínas de surimi besugo durante seis meses de almacenamiento por congelado. Las características analizadas fueron actividad Ca2-ATPasa, solubilidad de proteína, contenido de sulfhidrilos, electroforesis, morfología de superficie y estabilidad termal. La eficacia de todos los crioprotectores disminuyó en general al aumentar el tiempo de almacenamiento. La polidextrosa fue capaz de mantener la actividad Ca2-ATPasa, solubilidad de proteína y contenido de sulfhidrilos de 33.5%, 71.3% y 71.8%, respectivamente. La sacarosa fue capaz de mantener la actividad Ca2-ATPasa, solubilidad de proteína y contenido de sulfhidrilos en un 32.4%, 68.1% y 75.6%, respectivamente. La electroforesis mostró que MHC y la intensidad de bandas de actina casi habían desaparecido al final del período de almacenamiento. El análisis con SEM demostró que el número de poros formados aumentó tras el almacenamiento. El análisis de estabilidad termal mostró una disminución de miosina pero no un cambio significativo en el contenido de actina. Este estudio sugiere que la polidextrosa como crioprotector es capaz de mantener la proteína de desnaturalización como la sacarosa.
Introduction
Surimi is composed of stabilized myofibrillar proteins obtained from mechanically deboned fish flesh that is washed with water and blended with a cryoprotectant. Myofibrillar protein still undergoes deterioration, especially protein denaturation, which results in poor functionality due to freezing (Park & Lin, Citation2005). The addition of a cryoprotectant to raw surimi can overcome this problem and retain the functional properties of surimi (Okada, Citation1992).
A commonly cryoprotectant used is a mixture of sucrose and sorbitol in a 1:1 ratio with sodium tripolyphosphate added as synergist (MacDonald & Lanier, Citation1991; Yoon & Lee, Citation1990). Surimi manufactured from warm-water species typically used 6% of sucrose due to higher thermal stability (Park & Lin, Citation2005). However, the incorporation of sucrose imparts a sweet taste and high calorie value in surimi (Carvajal, MacDonald, & Lanier, Citation1999). Low-sweetness additives can be used as an alternative to overcome this problem. Many studies have been conducted regarding the use of low-sweetness additives. Pan, Shen, and Luo (Citation2010) and Zhou, Benjakul, Pan, Gong, and Liu (Citation2006) reported that trehalose exerts excellent cryoprotective effects on grass carp and tilapia surimi. Herrera and Mackie (Citation2004) reported that polydextrose and lactitol are highly effective in preventing Ca2+-ATPase activity in rainbow trout actomyosin during the first 24 h of storage. Sych, Lacroix, Adambounou, and Castaigne (Citation1990) suggested that palatinit stabilizes cod surimi proteins as well as a sucrose/sorbitol mixture does. Carvajal et al. (Citation1999) have reported the effective cryoprotection of Alaska pollock surimi by maltodextrin.
Threadfin bream (Nemipterus spp.) is the main fish species used in Southeast Asia for surimi production. Guenneugues and Morrisey (Citation2005) describe threadfin bream as being white in color and possessing a smooth texture, a strong gel-forming ability, and easy process ability; thus, it is widely used as a raw material for the production of Japanese “kamaboko” and surimi-based crabstick.
However, studies concerning the cryoprotective effect of low-sweetness additives on marine tropical fish are lacking. The objectives of this work were to investigate the effect of different types of low-sweetness additives (lactitol, maltodextrin, palatinit, polydextrose, trehalose) on the protein denaturation of threadfin bream surimi by measuring Ca2+-ATPase activity, protein solubility, sulfhydryl (SH) content, electrophoresis, surface morphology, thermal stability and to compare their effectiveness with that of sucrose.
Materials and methods
Surimi preparation
Threadfin bream surimi was prepared at QL Food Sdn. Bhd., Hutan Melintang, Perak, Malaysia. Different types of low-sweetness additives at the same concentration (6%) with 0.3% sodium tripolyphosphate were added to the surimi. The samples are identified in . After mixing, the surimi was packed in polyethylene bags; each package weighed 10 kg and was frozen using a contact plate freezer. Frozen surimi blocks were transported to Universiti Sains Malaysia by a refrigerated truck.
Table 1. Low-sweetness additives used in experimental surimi.
Tabla 1. Aditivos de bajo dulzor usados en surimi experimental.
Table 2. Changes in T
max (°C) of myosin threadfin bream surimi with different cryoprotectants during six months of frozen storage.
Tabla 2. Cambios en T
max (°C) de miosina de surimi de besugo con diferentes crioprotectores durante seis meses de almacenamiento por congelación.
Table 3. Changes in T
max (°C) of actin threadfin bream surimi with different cryoprotectants during six months of frozen storage.
Tabla 3. Cambios en T
max (°C) de actina de surimi de besugo con diferentes crioprotectores durante seis meses de almacenamiento por congelación.
Storage study
Surimi samples were stored in a freezer at −18°C. Surimi samples were evaluated every month over a six-month period of frozen storage. The following analyses were conducted: Ca2+-ATPase activity, protein solubility, SH content, electrophoresis, scanning electron microscopy, and thermal stability.
Ca2+-ATPase activity
Actomyosin was prepared according to the method of Benjakul, Seymour, and Morrisey (Citation1997). Surimi (3 g) was homogenized in 30 ml of chilled 0.6 M KCl (pH 7.0) for 4 min with an IKA®T25 digital ultra-turrax®, Germany homogenizer, and the sample container was placed on ice. Each 20 s of homogenization was followed by a 20-s rest interval to avoid overheating during extraction. The homogenate was centrifuged at 8370 g for 30 min at 4°C in a Kubota 6500 centrifuge. Three volumes of chilled distilled water were added to precipitated actomyosin. Actomyosin pellets were collected by centrifugation at 8370 g for 20 min at 4°C and then dissolved by stirring in an equal volume of chilled 0.6 M KCl (pH 7.0). Undissolved debris was removed by centrifugation at 8370 g for 30 min at 4°C. Actomyosin was kept on ice during all analyses. The following analyses and techniques required actomyosin: Ca2+-ATPase activity, SH content, protein solubility, and SDS-PAGE.
The Ca2+-ATPase activity measurement was performed as described by Wang, Xiong, and Srinivasan (Citation1997), in which 0.2 mL actomyosin was diluted in a reaction solution (7.6 mM ATP; 15 mM CaCl2; 150 mM KCl; and 180 mM Tris-HCl, pH 7.4). The reaction was performed at 25°C for 10 min, and 1.0 mL of 10% trichloroacetic acid was added to stop the reaction. The mixture was subsequently centrifuged at 3500 g for 5 min, and 1.0 mL of the supernatant was reacted with 3.0 mL of 0.66% ammonium molybdate in 0.75 N sulfuric acid. A 0.5-mL aliquot of freshly prepared 10% FeSO4 in 0.15 N sulfuric acid was then added, and the mixture was allowed to react for 2 min for color development. The absorbance was read at 700 nm to determine the ATPase activity. NaH2PO4 was used to prepare the standard curve for phosphate calculation.
Protein solubility
Protein solubility was determined using the Kjeldahl method according to Association of Official Analytical Chemist [AOAC] (2000). Briefly, a sample (actomyosin) was digested, distillated and titrated using 0.02 N HCl. Protein levels were calculated using a conversion factor of 6.25. The protein solubility was calculated using the following formula:
Sulfhydryl (SH) content
The procedure used to measure the SH content was previously described by Wang et al. (Citation1997). A 0.5-mL aliquot of actomyosin was mixed with 1.0 mL of a urea and sodium dodecyl sulfate (SDS) solution (8.0 M urea, 3% SDS and 100 mM phosphate buffer with a final pH of 7.4). The titration of SH was initiated by the addition of 0.5 mL of 5,5′-dithio-bis (2-nitrobenzoic-acid) (DTNB) reagent (10 mM DTNB in 0.1 M phosphate buffer with a final pH of 7.4). A sample blank was run with 0.5 mL of phosphate buffer without DTNB. A reagent blank was run with only water. The absorbance was read at 420 nm after 15 min at room temperature. The concentration of SH was calculated using a molar extinction coefficient of 11400 M−1cm−1.
Sodium dodecyl sulfate polyacrylamide gel electrophoresis (SDS-PAGE)
The SDS-PAGE procedure was followed according to the instructions provided by Wealtec for their V-Ges vertical gel electrophoresis version 1.0 instrument and the method previously described by Laemmli (Citation1970). A 12% resolving gel and a 5% stacking gel were used. The sample buffer consisted of 1.5 M Tris-HCl pH 6.8, 2 M Dithiothreitol (DTT), SDS, bromophenol blue, and glycerol in deionized water. Sample preparation was conducted by mixing protein samples with loading buffer in a ratio 1:1 and heating the mixture to 100°C for 5 min to denature the protein samples. An SDS-PAGE broad-range molecular weight standard (6.5 to 200 kDa) (Bio-Rad, Alfred Nobel Drive, Hercules, CA) was used. The running buffer consisted of 12 mM Tris base, 192 mM glycine and 0.1% SDS (w/v) in deionized water. The voltage that was used to pre-run the gel was 80 V for 20 min and 120 V for 80 min to run the gel. Gels were then immersed in deionized water for 5 min and stained with a coomassie blue stain buffer for 20 min destained with a destaining buffer for 1 min. The gels were then immersed in 1% acetic acid and incubated for 1 h on a shaker. Acetic acid was replenished every hour until the gel was completely destained, and the gels were visualized using an UV Tec gel imaging system (Cambridge, UK) that used UVI band version 12.11 software (serial number 08.630445).
Scanning electron microscopy (SEM)
The microstructure of the surimi gels was determined via SEM. The SEM procedure followed was previously described by Rawdkuen and Benjakul (Citation2008). Briefly, the surimi gels were prepared by cutting them into slices of 2–3 mm thickness. The slices of surimi gel were freeze-dried for three days. The dried samples were cut (0.5 cm × 0.5 cm) and placed on an aluminum stub using carbon tape; the samples were then coated with gold for approximately 60 s. The specimens were observed with a scanning electron microscope (LEO supra 50VP field emission SEM Carl-Ziess SMT; Oberkochen, Germany).
Changes in thermal stability
The changes in the thermal stability of actin and myosin in threadfin bream surimi were monitored via Differential Scanning Calorimetry (DSC) as previously described (Nasab, Alli, Ismail, & Ngadi, Citation2005). Briefly, freeze-dried samples were subjected to thermal analysis using a differential scanning calorimeter Q100 equipped with a DSC refrigerated cooling system and monitored by Universal Analysis 2000 software (ver.3.7A). Nitrogen was used as the purge gas (50 mL/min) for all scans. The heat flow and melting points were calibrated from the melting endotherm of indium. The heating rate used for calibration was the same as that used to analyze the scanned samples. Samples were weighed (2–3 mg) into aluminum pans with the addition of phosphate buffer (pH 7.4) until a total weight of 13–15 mg was reached. The pans were sealed hermetically and placed on the calorimetric cell of the Q100. The cell was allowed to equilibrate to 25°C and was then heated to 100°C at a rate of 5°C/min.
Statistical analysis
The experiments were run in two replications; each replication was performed in triplicate. Data were subjected to analysis of variance (ANOVA) at a 5% significance level. A comparison of means was performed by Duncan's test to determine the significant difference between treatments at P < 0.05.
Results and discussion
Changes in Ca2+-ATPase activity
Ca2+-ATPase activity can reflect the integrity of myosin molecules (Benjakul et al., Citation1997). The Ca2+-ATPase activity of all the samples is shown in . The results show that each cryoprotectant produced a different effect on surimi during freezing. The Ca2+-ATPase activity of each treatment was in the range 49.44–380.97 μg Pi/mg protein/10 min. Benjakul, Visessanguan, Thongkaew, and Tanaka (Citation2005) reported that the Ca2+-ATPase activity of surimi made from fish commonly used for surimi production in Thailand (croacker, lizardfish, threadfin bream, bigeye snapper) mixed with sorbitol and sucrose was in the range 23.25–100.75 μg Pi/mg protein/10 min over 25 weeks of frozen storage, which is lower than the activity observed for the surimi samples in this study. The highest Ca2+-ATPase activity was observed for surimi treated with polydextrose as the cryoprotectant after six months of frozen storage; the recorded activity was significantly different (P < 0.05) from that of the other samples. Herrera and Mackie (Citation2004) also reported that polydextrose was highly effective in preserving Ca2+-ATPase activity, decreasing sharply after eight weeks of storage compared with glucose syrup and sucrose/sorbitol in the actomyosin of rainbow trout. The lowest Ca2+-ATPase activity was observed in raw surimi. Surimi treated with sucrose also showed lower Ca2+-ATPase activity than surimi treated with polydextrose.
Figure 1. Changes in Ca2+-ATPase activity of surimi gel with different cryoprotectants during six months of frozen storage. Values shown are averages of triplicate analysis of duplicate surimi blocks. Data are shown as the mean ± SD.
Figura 1. Cambios en la actividad Ca2-ATPasa de gel de surimi con diferentes crioprotectores durante seis meses de almacenamiento por congelado. Los valores que se muestran son el promedio de análisis triplicados de bloques de surimi duplicados. Los datos se muestran como media ± desviación estándar.
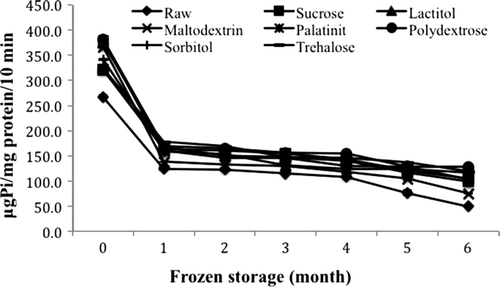
The decrease in Ca2+-ATPase activity for all the treatments over six months of frozen storage varied significantly (P < 0.05) from month to month. The initial Ca2+-ATPase activities of raw surimi, sucrose, lactitol, maltodextrin, palatinit, polydextrose, sorbitol, and trehalose were 267.2, 320.4, 375.2, 365.4, 379.9, 381.0, 341.6, and 322.9 μg Pi/mg protein/10 min, respectively. The final values were 49.4, 103.9, 99.2, 75.0, 117.9, 127.8, 103.2, and 119.2 μg Pi/mg protein/10 min, respectively. The same trends were reported by Benjakul et al. (Citation2005) and Pan et al. (Citation2010); the Ca2+-ATPase activity of threadfin bream surimi and grass carp surimi mixed with sorbitol/sucrose and trehalose also decreased over six months and 25 weeks of frozen storage, respectively.
The denaturation of muscle protein was indicated by the reduced Ca2+-ATPase activity and the change in surface hydrophobicity. This might result in poor gel-forming ability (Chaijan, Benjakul, Visessanguan, & Faustman, Citation2006). Lanier, Carvajal, and Yongsawatdigul (Citation2005) have also suggested that a decrease in the Ca2+-ATPase activity of actomyosin during the frozen storage of fish is accompanied by the reduced gel strength of surimi made from the fish.
In this study, the sharp decrease in the Ca2+-ATPase activity of raw surimi indicates the large degree of denaturation of myosin. The added cryoprotectants, however, were able to provide protection against drastically reduced Ca2+-ATPase activity. According to this study, surimi treated with a cryoprotectant could maintain its Ca2+-ATPase activity during frozen storage. This study also proved that polydextrose is slightly better at maintaining Ca2+-ATPase activity than sucrose during six months of frozen storage.
Changes in protein solubility
Myofibrillar protein is a protein that is soluble in salt. Salt solubility is one of the main characteristics of myofibrillar protein. The protein solubility of all the samples is shown in . This figure shows that each cryoprotectant produced a different effect in the surimi during the freezing process. The protein solubility values were in the range 9.63–60.10%. Benjakul et al. (Citation2005) reported that the protein solubility of surimi made from some tropical fish in Thailand mixed with sorbitol and sucrose was in the range 17.50–90.00% during 25 weeks of frozen storage, which is higher than the protein solubility values observed in surimi samples in this study. Among all of the samples, raw surimi showed the lowest protein solubility from the beginning until the end of frozen storage (P < 0.05). For samples treated with cryoprotectant, the lowest protein solubility was exhibited by the maltodextrin-treated surimi. Polydextrose showed the highest value for protein solubility among the other samples from zero to six months of frozen storage. Zhou et al. (Citation2010) reported that polydextrose could retard the decrease in protein solubility of darce (Cyprinus sp) surimi until 26 weeks of frozen storage.
Figure 2. Changes in protein solubility of surimi gel with different cryoprotectants during six months of frozen storage. Values shown are averages of triplicate analysis of duplicate surimi blocks. Data are shown as the mean ± SD.
Figura 2. Cambios en solubilidad de proteínas de gel de surimi con diferentes crioprotectores durante seis meses de almacenamiento por congelado. Los valores que se muestran son el promedio de análisis triplicados de bloques de surimi duplicados. Los datos se muestran como media ± desviación estándar.
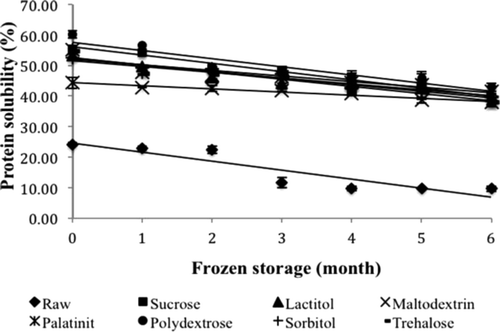
Generally, the protein solubilities of all the samples decreased as the storage time increased and were significantly different (P < 0.05). The initial protein solubility values of raw surimi, sucrose, lactitol, maltodextrin, palatinit, polydextrose, sorbitol, and trehalose were 24.15%, 55.37%, 53.22%, 44.28%, 55.07%, 60.10%, 52.41%, and 54.61%, respectively. The values at the end of frozen storage were 9.63%, 37.71%, 39.94%, 37.81%, 41.48%, 42.84%, 39.64%, and 37.82%, respectively. The decreasing trend in protein solubility was also reported by Pan et al. (Citation2010) with respect to the protein solubility of grass carp surimi treated with trehalose over 25 weeks of frozen storage.
The decrease in protein solubility is the main indicator of protein denaturation during frozen storage (Benjakul & Bauer, Citation2000). The sharp decrease in the protein solubility of threadfin bream surimi without a cryoprotectant means that proteins underwent denaturation induced by frozen storage. The rapid decrease in protein solubility during frozen storage has been noted for tilapia surimi treated with trehalose when a cryoprotectant is not incorporated (Zhou et al., Citation2006). The slower decrease in the protein solubility of surimi with the addition of a cryoprotectant suggests that cryoprotectants prevent proteins from denaturation. According to this study, polydextrose exhibits a greater effect in maintaining the protein solubility of threadfin bream surimi as the same as sucrose.
Changes in SH content
SH groups are the most reactive functional groups in proteins (Sultanbawa & Li-Chan, Citation2001). The SH groups of proteins can be oxidized to disulfide groups and cause a decrease in the SH content during frozen storage (Pan et al., Citation2010). The SH content of each treatment is shown in . The SH content of all the samples was in the range 7.39–15.71 mol SH/105g protein. Pan et al. (Citation2010) reported that the SH content of grass carp surimi was in the range 4.75–7.38 mol SH/105g protein during 25 weeks of frozen storage, which is lower than that observed for surimi samples in this study.
Figure 3. Changes in SH content of surimi gel with different cryoprotectants during six months of frozen storage. Values shown are averages of triplicate analysis of duplicate surimi blocks. Data are shown as the mean ± SD.
Figura 3. Cambios en contenido de SH de gel de surimi con diferentes crioprotectores durante seis meses de almacenamiento por congelado. Los valores que se muestran son el promedio de análisis triplicados de bloques de surimi duplicados. Los datos se muestran como media ± desviación estándar.
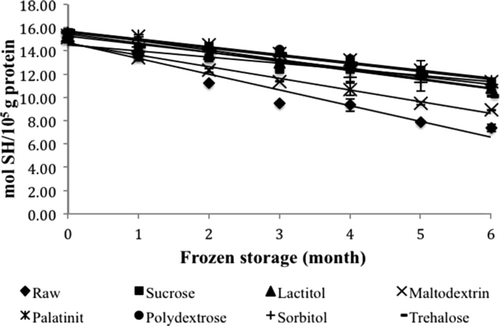
Generally, the SH content of all the samples decreased as the storage time increased and was significantly different (P < 0.05) from month to month. The initial SH contents of raw surimi, sucrose, lactitol, maltodextrin, palatinit, polydextrose, sorbitol, and trehalose were 15.54, 15.02, 15.52, 15.18, 15.32, 15.54, 15.54, 15.71 mol SH/105g, respectively. The final values after six months of frozen storage were 7.39, 11.35, 10.78, 8.93, 11.34, 11.16, 11.14, and 10.13 mol SH/105g, respectively. Raw surimi lost about 52.48% of its initial SH content after six months of frozen storage; this decrease was the highest among all of the samples. For surimi featuring a cryoprotectant, the maltodextrin-treated sample showed the greatest decrease of 41.16%. Sucrose showed the lowest decrease among the other samples, and followed by palatinit 25.99%, polydextrose 28.15%, sorbitol 28.30%, lactitol 30.53%, and treahalose 35.55%. A similar decreasing trend was also reported by Zhou et al. (Citation2006) and Pan et al. (Citation2010) with respect to the SH content of tilapia and grass carp surimi treated with trehalose during 25 weeks of frozen storage.
According to Pan et al. (Citation2010), the sharp decrease in the SH content of the raw surimi in this study indicates the denaturation of threadfin bream protein, and the lower rates of decrease of the other seven samples suggests a cryoprotective effect in alleviating the denaturation of threadfin bream protein. The decrease is considered to be due to the formation of disulfide bonds via the oxidation of SH groups or disulfide interchange (Benjakul & Bauer, Citation2000). Lanier et al. (Citation2005) have suggested that the oxidation of SH groups to disulfide linkages leads to protein aggregation typically during the storage of fish on ice. This oxidation also inactivates the Ca2+-ATPase activity of actomyosin because SH groups located in the head portion of myosin have been found to play an important role in ATPase activity. Hence, the decrease in Ca2+-ATPase activity is in agreement with the decrease in the total SH content.
Changes in sodium electrophoresis
Myosin heavy chain (MHC) was found to be the major protein band in the studied samples, followed by actin. The MHC and actin band intensity of all the samples, which are shown to have decreased with storage time, is presented in . The intensity of the MHC and actin bands at zero and three months did not show much change. At six months of frozen storage, the MHC and actin band showed a decrease in intensity and almost disappeared, especially in raw surimi. The disappearance of the MHC band in surimi without a cryoprotectant was also reported by Sultanbawa and Li-Chan (Citation1998) with respect to the SDS-PAGE profile of ling cod surimi containing no added cryoprotectant at four months of frozen storage.
Figure 4. SDS-PAGE during six months of storage and a one-dimensional image of threadfin bream surimi at zero month (a), three months (b), and six months (c). The numbers represent the conditions as follows: L1 = Lactitol, L2 = Maltodextrin, L3 = Palatinit, L4 = Polydextrose, L5 = Sorbitol, L6 = Sucrose, L7 = Trehalose, L8 = Raw, L9 = Standard; MHC, myosin heavy chain.
Figura 4. SDS-PAGE durante seis meses de almacenamiento e imagen unidimensional de surimi de besugo a 0 meses (a), tres meses (b) y seis meses (c). Los números representan las condiciones como se indica: L1 = lactitol, L2 = maltodrextina, L3 = palatinita, L4 = polidextrosa, L5 = sorbitol, L6 = sacarosa, L7 = trehalosa, L8 = crudo, L9 = estándar, MHC, cadena pesada de miosina.
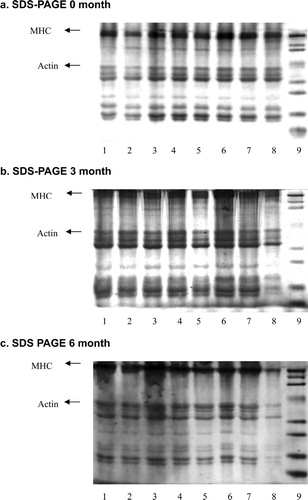
The decrease in the intensity of the MHC and actin bands was due to protein denaturation especially actomyosin during frozen storage. Surimi actomyosin treated with a cryoprotectant still exist, although at a smaller concentration, after six months of frozen storage. This indicates that the cryoprotectants added to surimi are effective in preventing the aggregation and subsequent insolubility of myosin and actin during frozen storage (Sultanbawa & Li-Chan, Citation1998).
Changes in thermal stability
The differential scanning calorimetry thermograms of myosin and actin for each treatment during six months of frozen storage are shown in and . The peak maximum temperatures (T max) were used to describe the denaturation temperatures of the proteins. Thermograms normally consist of two endothermic transitions: the first peak for the myosin transition and the second peak for the actin transition (Sych et al., Citation1990). The myosin transition temperatures of all the samples were in the range 42.10–47.83°C. Sych et al. (Citation1990) reported that the overall mean myosin transition temperatures for cod surimi treated with sucrose/sorbitol, polydextrose, palatinit, and lactitol were 48.7°C, 49.0°C, 49.1°C, and 49.1°C, respectively, during 12 weeks of frozen storage, which are higher than those observed for surimi samples in this study. The difference in temperature may be due to the different materials that were used. The myosin transition temperature showed that from zero to six months of frozen storage, the samples showed considerable stability and there were no significance differences (P < 0.05) among the samples treated with a cryoprotectant, except for maltodextrin, which showed a decrease and significantly different (P < 0.05) temperature from the other samples treated with a cryoprotectant. The decrease in the myosin transition temperature of maltodextrin, palatinit, sucrose and treahalose began at the end of frozen storage, and the samples' final temperatures were significantly different (P < 0.05) from their initial temperature. From zero to six months, the myosin transition temperature of raw surimi was lower than that of surimi treated with a cryoprotectant. This indicates that cryoprotectants can prevent myosin from rapid denaturation.
The actin transition temperature was in the range 66.49–69.62°C. Sych et al. (Citation1990) reported that the actin transition temperatures of cod surimi treated with sucrose/sorbitol, polydextrose, palatinit, and lactitol were 72.8°C, 73.0°C, 73.2°C, and 72.9°C, respectively, during 12 weeks of frozen storage, which are higher than those of the surimi samples in this study. Overall, the decrease in the actin transition temperature of all the samples was not significantly different (P < 0.05) until after six months of frozen storage, except for polydextrose-treated sample, whose transition temperature decrease was significantly different from its initial value after six months of frozen storage. The actin transition temperatures of all the samples were also significantly different, except for the sucrose-treated sample after six months of frozen storage. Sych et al. (Citation1990) reported that actin was more stable than myosin in cod surimi during 16 weeks of frozen storage. Hence, the actin transition temperature of all the samples in this study showed no significant changes.
Sych et al. (Citation1990) suggested that DSC studies of T max provide information regarding the protein stability of surimi during frozen storage. This study proves that cryoprotectants prevent extensive protein denaturation in threadfin bream surimi during six months of frozen storage.
Changes in scanning electron microscopy
Scanning electron microscopy images of surimi gel prepared from different cryoprotected samples are shown in . Jafarpour and Gorczyca (Citation2008) revealed that retention of more myofibrillar proteins resulted in a more compact gel matrix. Generally, at zero month of frozen storage, the gel microstructures of all the samples were compact and contained few of pores, but at three months of frozen storage, the number of pores increased. The number of pores became even greater at six months of frozen storage, and the gel microstructure became less compact compared with initial condition, especially in raw surimi. Surimi with a cryoprotectant generally showed that the cryoprotectant was able to prevent drastic protein aggregation and produce less pores for up to three months of frozen storage, but after six months of frozen storage, the number of pores in almost all of the samples increased, except for polydextrose. Hence, raw surimi shows a large number of pores and loose structure starting at three months of frozen storage.
Figure 5. SEM images of threadfin bream surimi with different cryoprotectants during six months of frozen storage (magnification 50×).
Figura 5. Imágenes SEM de surimi de besugo con diferentes crioprotectores durante seis meses de almacenamiento por congelación (magnificación 50×).
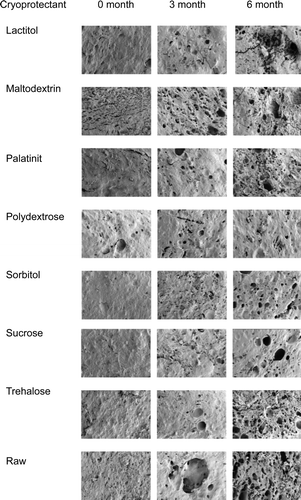
There is correlation between the increasing numbers of pores in surimi gel and water-holding capacity. The increase in the number of pores indicates a poor gel matrix with a lower water-holding capacity. Niwa (Citation1992) suggested that the degradation of MHC would naturally lead to the breakdown of the formed network structure of surimi gel. Benjakul et al. (Citation2005) also reported that large voids in frozen fish are caused by protein aggregation and are accompanied by a decrease in water-holding capacity. As a result, the inferior structure of surimi gel prepared from frozen fish confirms the poorer gel-forming ability of muscle proteins in frozen fish.
Conclusion
Surimi blended with a cryoprotectant is generally able to withstand protein denaturation during six months of frozen storage, whereas raw surimi is not. Polydextrose exerted better cryoprotection than other cryoprotectants due to higher Ca2+-ATPase, protein solubility, and SH content and can be an alternative as a new kind of nonsweet cryoprotectant for application in surimi where sweetness is undesirable and provides a sugar substitute with diminished caloric value.
Acknowledgments
The authors acknowledge with gratitude the support given by Universiti Sains Malaysia for their research in this area and USM Fellowship and also the aid of the research grant from Malayan Sugar Manufacturing Company Berhad.
References
- Association of Official Analytical Chemist . 2000 . Official methods of analysis , (17th ed. , Gaithersburg , , MD : Association of Official Analytical Chemist .
- Benjakul , S. and Bauer , F. 2000 . Physicochemical and enzymatic changes of cod muscle proteins subjected to different freeze-thaw cycles . Journal of the Science of Food and Agriculture , 80 : 1143 – 1150 . doi: 10.1002/1097-0010(200006)80:8<1143::AID-JSFA61 0>3.0.CO;2-C
- Benjakul , S. , Seymour , T.A. and Morrissey , M.T. 1997 . Physicochemical changes in pacific whiting muscle proteins during ice storage . Journal of Food Science , 62 : 729 – 733 . doi: 10.1111/j. 1365-2621.1997.tb15445.x
- Benjakul , S. , Visessanguan , W. , Thongkaew , C. and Tanaka , M. 2005 . Effect of frozen storage on chemical and gel-forming properties of fish commonly used for surimi production in Thailand . Food Hydrocolloid , 19 : 197 – 207 . doi: 10.1016/j.food hyd.2004.05.004
- Carvajal , P.A. , MacDonald , G.A. and Lanier , T.C. 1999 . Cryostabilization mechanism of fish muscle proteins by maltodextrins . Journal of Cryobiology , 38 : 16 – 26 . doi:10.1006/Cryo.1998.2142
- Chaijan , M. , Benjakul , S. , Visessanguan , W. and Fautsman , C. 2006 . Physichochemical properties, gel-forming ability and myoglobin content of sardine (Sardinella gibbosa) and mackerel (Rastrelliger kanagurta) surimi produced by convetional method and alkaline solubilisation process . European Food Research Technology , 222 : 58 – 63 . doi: 10.1007/s00217-005-0091-1
- Guenneugues , P. and Morrisey , M.T. 2005 . “ Surimi resources ” . In Surimi and Surimi Seafood , (2nd ed. , Edited by: Park , J.W. 3 – 32 . Boca Raton, FL : Taylor and Francis Group .
- Herrera , J.R. and Mackie , I.M. 2004 . Cryoprotection of frozen-stored actomyosin of farmed rainbow trout (Onchorhynchus mykiss) by some sugars and polyols . Food Chemistry , 84 : 91 – 97 . doi: 10.1016/S0308-8146(03)00178-X
- Jafarpour , A. and Gorczyca , E.M. 2008 . Alternative techniques for producing a quality surimi and kamaboko from common carp (Cyprinus carpio) . Journal of Food Science , 73 : E415 – E424 . doi: 10.1111/j.1750-3841.2008.00937.x
- Laemmli , U.K. 1970 . Cleavage of structural proteins during the assembly of the head of bacteriophage T4 680 – 685 . doi: 10.1038/227680a0
- Lanier , T.C. , Carvajal , P. and Yongsawatdigul , J. 2005 . “ Surimi gelation chemistry ” . In Surimi and surimi seafood , (2nd ed. , Edited by: Park , J.W. 33 – 106 . Boca Raton, FL : Taylor and Francis Group .
- MacDonald , G.A. and Lanier , T.C. 1991 . Carbohydrates as cryoprotectants for meats and surimi . Food Technology , 45 : 152 – 154 . doi: 10.1111/j.1365-2621.1994.tb06907.x
- Nasab , M.M. , Alli , I. , Ismail , A.A. and Ngadi , M.O. 2005 . Protein structural changes during preparation and storage of surimi . Journal of Food Science , 70 : 448 – 453 . doi: 10.1111/j.1365-2621.2005.tb11467.x
- Niwa , E. 1992 . “ Chemistry of surimi gelation ” . In Surimi technology , Edited by: Lanier , T.C. and Lee , C.M. 389 – 427 . New York : Marcel Dekker, Inc .
- Okada , M. 1992 . “ History of surimi technology in Japan ” . In Surimi technology , Edited by: Lanier , T.C. and Lee , C.M. 3 – 21 . New York : Marcel Dekker Inc .
- Pan , J. , Shen , H. and Luo , Y. 2010 . Cryoprotective effects of trehalose on grass carp (Ctenopharyngodon idellus) surimi during frozen storage . Journal of Food Processing Preservation , 34 : 715 – 727 . doi: 10.1111/j.1745-4549.2009.00388.x
- Park , J.W. and Lin , T.M.J. 2005 . “ Surimi: manufacturing and evaluation ” . In Surimi and Surimi Seafood , (2nd ed. , Edited by: Park , J.W. 33 – 106 . Boca Raton, FL : Taylor and Francis Group .
- Rawdkuen , S. and Benjakul , S. 2008 . Whey protein concentrate: autolysis inhibition and effects on the gel properties of surimi prepared from tropical fish . Food Chemistry , 106 : 1077 – 1084 . doi: 10.1016/j.foodchem.2007.07.028
- Sultanbawa , Y. and Li-Chan , E.C.Y. 1998 . Cryoprotective effects sugar and polyol blends in ling cod surimi during frozen storage . Food Research International , 31 : 87 – 98 . doi: 10.1016/S0963-99 69(98)00063-5
- Sultanbawa , Y. and Li-Chan , E.C.Y. 2001 . Structural changes in natural actomyosin and surimi from ling cod (Ophiodon elongatus) during frozen storage in the absence or presence of cryoprotectants . Journal Of Agricultural And Food Chemistry , 49 : 4716 – 4725 . doi: 10.1021/jf001281x
- Sych , J. , Lacroix , C. , Adambounou , L.T. and Castaigne , F. 1990 . Cryoprotective effects of lactitol, palatinit and polydextrose on cod surimi proteins during frozen storage . Journal of Food Science , 55 : 356 – 360 . doi: 10.1111/j.1365-2621.1990.tb06762.x
- Wang , B. , Xiong , Y.L. and Srinivasan , S. 1997 . Chemical stability of antioxidant-washed beef heart surimi during frozen storage . Journal of Food Science , 62 : 939 – 945 . 991. doi: 10.1111/j.1365-2621.1997.tb15011.x
- Yoon , K.S. and Lee , C.M. 1990 . Cryoprotective effects in surimi and surimi/minced-based extruded products . Journal of Food Science , 55 : 1210 – 1216 . doi: 10.1111/j.1365-2621.1990.tb03900.x
- Zhou , A. , Benjakul , S. , Pan , K. , Gong , J. and Liu , X. 2006 . Cryoprotective effects of trehalose and sodium lactate on tilapia (Sarotherodon nilotica) surimi during frozen storage . Food Chemistry , 96 : 96 – 103 . doi: 10.1016/j.foodchem.2005.02.013
- Zhou , A. , Gong , C. , Cao , H. , Guo , W. , Liu , X. and Chen , Y. 2010 . Study on cryoprotective effects of some new cryoprotectants on darce surimi during frozen storage . Science and Technology of Food Industry , : 2010 – 2011 . Retrieved from http://en.cnki.com.cn/Article_en/CJFDTOTAL-SPKJ201011088.htm. doi: CNKI: SUN:SPKJ.0.2010-11-088