
Abstract
Ultrasound is regarded as a potential alternative method for improving the quality of some wines. This study was initiated with the objective of evaluating the effects of ultrasound on some important physicochemical properties of red wine such as chromatic characteristics (CC), electrical conductivity (EC), pH, titratable acidity (TA), total phenolic compounds (TPCs) and DPPH (1,1-diphenyl-2-picryl-hydrazyl) free radical scavenging activity (DFRSA). The operational parameters assessed were ultrasound power, ultrasound frequency, exposure time and bath temperature. Results illustrated that there were significant changes in CC, EC and TPC while pH and TA hardly changed except for samples treated at high temperatures. DFRSA was correlated to TPC during ultrasonic treatment. Application of principal component analysis to the experimental data suggested that exposure time was the factor with the greatest ability to induce changes on wine. Results suggested that ultrasound may be applied to improve some physicochemical properties of red wine.
El ultrasonido se considera uno de los métodos alternativos potenciales para mejorar la calidad de algunos vinos. Se comenzó este estudio con el objetivo de evaluar los efectos del ultrasonido en algunas de la propiedades fisicoquímicas importantes del vino tinto como son: las características cromáticas (CC), la conductividad eléctrica (EC), el pH, la acidez (TA), los compuestos fenólicos totales (TPC) y el DPPH (1,1-difenil-2-picrilhidrazil) de actividad de eliminación de radicales libres (DFRSA). Los parámetros operacionales examinados fueron: la potencia de ultrasonido, la frecuencia de ultrasonido, el tiempo de exposición y la temperatura de baño. Los resultados ilustraron la existencia de cambios significativos en CC, EC y TPC, mientras que el pH y TA prácticamente no cambiaron excepto en las muestras tratadas con altas temperaturas. DFRSA tuvo correlación con TPC durante el tratamiento con ultrasonido. La aplicación de análisis de componentes principales a los datos experimentales sugirió que el tiempo de exposición era el factor con mayor habilidad para inducir cambios en el vino. Los resultados sugirieron que el ultrasonido podría aplicarse para mejorar algunas de las propiedades fisicoquímicas del vino tinto.
1. Introduction
Generally speaking, the winemaking process can be divided into fermentation and aging. First, yeasts turn wine sugars into carbon dioxide, thermal energy and ethanol. A secondary fermentation (malolactic fermentation), conducted by lactic acid bacteria, can take place as well. This fermentation contributes to microbial stability and deacidifies the wine. During wine aging, complex chemical reactions involving wine sugars, acids and phenolic compounds (primarily tannins and anthocyanins) can reduce wine astringency and bitterness and improve its organoleptic properties over time. Due to the shortcomings of traditional wine aging in oak barrels, such as the high cost, the limited life of oak barrels, potential microbiological contamination and losses during storage due to evaporation, innovative physical aging technologies have been developed, namely the addition of oak chips, application of micro-oxygenation, aging on lees or the use of some physical methods (García Martín & Sun, Citation2013; Tao, García, & Sun, Citation2014). Among all the physical aging technologies studied, ultrasound is regarded as the most promising for accelerating the wine aging process (García Martín & Sun, Citation2013). During ultrasonic treatment, high temperatures and high pressures generated by the collapse of micro-bubbles can induce chemical reactions within beverages (Suslick, Citation1998), thus accelerating some reactions that usually occur during wine aging. Some papers have illustrated the potential of ultrasound for accelerating the aging of several kinds of wine such as rice wine and rice alcoholic beverage (Chang, Citation2005; Chang & Chen, Citation2002), but not all. Thus, Chang and Chen (Citation2002) reported that 20 kHz ultrasonic wave treatment aged rice wine much more quickly than the conventional process, but failed in aging maize wine. With regard to grape wine, it is worth mentioning that Masuzawa, Ohdaira, and Ide (Citation2000) found that weak ultrasonic irradiation can promote an increase in the amount of phenolic compounds in red wine and they concluded that ultrasonic irradiation did meaningfully enhance wine maturation.
Despite these evidences of ultrasound-assisted aging in some kind of wines, the effects of ultrasound on red wine still remain to be demonstrated. Although some reactions typical of aging may be enhanced by means of ultrasound, some undesirable reactions or effects could also occur. Therefore, prior to assess the potential of ultrasound for assisting the aging of red wine, its effects on physicochemical properties, which are generally used to define wine quality, under different conditions should be investigated. As the most important operational parameters, the effects of ultrasound power, frequency, temperature and treatment time on red wine should be assessed during ultrasonic treatment. In this study, a commercial available red wine was subjected to sonication under different conditions of power, frequency, exposure time and temperature. The effects on wine physicochemical properties, including pH, titratable acidity (TA), electrical conductivity (EC), chromatic characteristics (CC), total phenolic compounds (TPC) and 1,1-diphenyl-2-picryl-hydrazyl (DPPH)-free radical scavenging activity (DFRSA), were evaluated. The main goal of this research was to assess whether ultrasound can positively modify the selected wine physicochemical parameters and what are the most suitable operational conditions for ultrasound treatment of red wine.
2. Materials and methods
2.1. Wine sample
A Cabernet Sauvignon red wine from the vintage 2012 was kindly donated by Danfeng Winery Ltd. (Shaanxi Province, China) and used throughout this research. The alcohol level of the red wine was provided by the producer, and was 12.0% (v/v).
2.2. Chemicals and reagents
DPPH, Folin–Ciocalteu reagent and gallic acid were obtained from Sigma-Aldrich Co. (St. Louis, MO, USA). Sodium carbonate, potassium dihydrogen phosphate and sodium hydroxide were purchased from Tianli Chemical Reagent Co. Ltd. (Tianjin, China). All other chemicals and reagents used were of analytical grade.
2.3. Ultrasonic treatment
Ultrasonic treatments were carried out in an ultrasonic bath (KQ-300VDE, Kunshan Ultrasonic Equipment Co. Ltd., Jiangsu Province, China) which can work at the frequencies of 45, 80 and 100 kHz with a variable power output. Ultrasonic energy was delivered from the bottom to the water in the tank by six annealed transducers, and their rated power output was 300 W. For each experimental run, 150 mL red wine were loaded into a 250-mL glass Erlenmeyer flask sealed with a plastic film, and then placed in the water bath and fixed at the same position during sonication. Water bath temperature was kept constant during sonication by means of Xiangya DLSB-5/20 circulation pump of closed-loop cryogenic refrigerator (Shanghai, China).
Four sets of experiment were performed. Firstly, the effect of different ultrasonic power levels (120, 150, 180, 210, 240, 270 and 300 W) was investigated, being the ultrasonic treatments performed at 20°C for 20 min with 100 kHz ultrasound. Subsequently, the effect of ultrasound frequency was assessed and samples were sonicated with 45, 80 and 100 kHz ultrasound, respectively, at the maximum ultrasound power level (300 W) for 20 min at 20°C. In parallel, another set of experiments was carried out with 100 kHz ultrasound (300 W power level) at different temperatures (20°C, 30°C, 40°C, 50°C and 60°C, respectively) for 20 min. Finally, in order to investigate the effects of ultrasound exposure time on wine, different treatment times were assayed including 20, 40, 60, 80 and 100 min. For this set of experiments, the selected frequency, ultrasound power and temperature were 100 kHz, 300 W and 20°C, respectively. Experiments were performed in duplicates.
2.4. Analytical determinations
2.4.1. Determination of total phenolic compounds
TPCs were determined using the method proposed by Rapisarda et al. (Citation1999) with some minor modifications. Briefly, 100 μL of sample, 7.0 mL of deionized water and 0.5 mL of Folin–Ciocalteu reagent were mixed and let stand for 1 min. Afterwards 1.5 mL of 20% sodium carbonate solution were added to the above mixture, and then it was made up to 10 mL by adding 0.9 mL of deionized water. The resulting mixture was incubated for 60 min in the dark at room temperature and then the absorbance was measured at 765 nm using a TU-1810 UV-Vis spectrophotometer (Beijing Persee General Instrument Co. Ltd., China). The results were expressed as gallic acid equivalents per liter of wine. All analyses were performed in triplicates.
2.4.2. Determination of chromatic characteristics
CC of wines were determined following the standard method OIV-MA-AS2-07B, by direct measurement of the absorbance of wines at 420 nm (intensity of yellow), 520 nm (intensity of red) and 620 nm (intensity of blue) with a 1-mm path-length quartz cuvette. The intensity of color was calculated as the sum of absorbances at 420, 520 and 620 nm. Tint was expressed as the ratio of absorbance at 420 to absorbance at 520 nm. Regarding CIELab parameters, lightness (L*), redness (a*) and yellowness (b*) were determined by a SC-80C automatic colorimeter (Beijing Kangguang instrument Co Ltd., China) following the recommendations of OIV-MA-AS2-11: R2006. The overall colorimetric differences between the ultrasonic treated samples and the untreated wine (CK) (ΔE*) were calculated as follows:
where ΔL*, Δa* and Δb* are the differences in the values of each color coordinate between the ultrasonic treated sample and the control wine (CK).
2.4.3. Determination of electrical conductivity, pH and titratable acidity
The EC and pH of samples were measured by a DDSJ-308F conductivity meter and a PHS-3C digital pH meter (Shanghai Leici Co. Ltd., China), respectively. The TA, expressed in equivalent of tartaric acid content (g/L), was measured by diluting a 10-mL aliquot of each sample with 90 mL of deionized water, and subsequently titrating the sample with 0.1 N NaOH to a pH endpoint of 8.1 (OIV-MA-AS313-01). All analyses were carried out in triplicates.
2.4.4. Determination of DPPH-free radical scavenging activity
The DFRSA of the samples was measured according to the method described by Zhang, Fan, Zhao, Wang, and Liu (Citation2013). Inhibition of the DPPH radical by wine samples was expressed as the percentage of DPPH decrease and was calculated according to the following formula:
where A0 is the absorbance of the control, and A1 is the absorbance of the sample. DFRSA of each sample was determined in triplicates.
2.5. Statistical analysis
Principal component analysis (PCA) attempts to identify underlying variables or factors that explain the pattern of correlations within a set of observed variables. PCA was carried out with the Unscrambler V 9.7 absolute version (CAMO, Trondheim, Norway).
Statistical analysis was performed by one-way analysis of variance (ANOVA) using the SPSS Statistics software version 11.0 (SPSS Inc., Chicago, IL, USA). Least significant difference test was applied to data in order to identify statistically significant differences. The different mean values that have the same letter superscripted means that there is no significant difference between (among) them. The coefficient correlation between TPC and DFRSA was also conducted.
3. Results
3.1. Effects of ultrasound power on TPC, EC, pH, TA, intensity and tint
Ultrasound did not change the pH and TA of wine () while the concentration of TPC in treated wines was lower than that of CK, and EC slightly increased after sonication. Regarding wine color, no pattern was found, although intensity and tint of some treated samples were slightly lower than those of untreated wine (CK).
Table 1. Effect of ultrasound power on physicochemical properties of wine.
Tabla 1. Efecto de la potencia ultrasónica en las propiedades fisicoquímicas del vino.
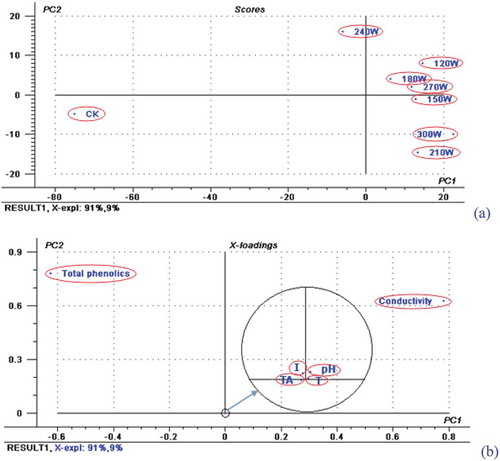
Regarding PCA, biplot of PC1 versus PC2 () was able to clearly differentiate the untreated wine (negative value on PC1) from ultrasonically treated samples (positive values on PC1, except for the sample treated at 240 W). PC1 accounted for 91% of the variation, which was highly correlated to the conductivity of wine. PC2 explained an additional 9% of the variation, which was correlated to TPC and EC.
Figure 1. Scatterplot of scores (a) and loadings (b) for PCA1 and PC2 of samples treated at different ultrasonic power.
Figura 1. Diagrama de dispersión de los resultados (a) y cargas (b) para PCA1 y PC2 de las muestras tratadas con diferentes potencias ultrasónicas.
3.2. Effect of ultrasound frequency on TPC, EC, pH, TA, intensity and tint
Physicochemical parameters of wines treated with different ultrasonic frequencies are shown in . ANOVA of pH, TA, intensity and tint values showed no significant differences. Again, TPC decreased and EC increased after sonication.
Table 2. Effect of ultrasonic frequencies on physicochemical properties of wine.
Tabla 2. Efecto de las frecuencias ultrasónicas en las propiedades físicoquímicas del vino.
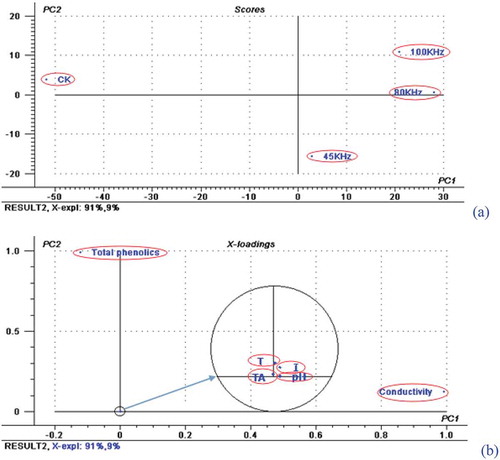
PCA result is shown in . From the first graph, two groups of samples (untreated and treated) were very well differentiated in PC1 dimension. PC1 and PC2 explained 91% and 9% of the total variance, respectively. PC1 was influenced by EC in an extensively manner while PC2 was highly correlated to TPC.
Figure 2. PCA scores (a) and loadings (b) for PC1 and PC2 of physicochemical properties of a red wine sonicated with different frequencies.
Figura 2. Resultados PCA (a) y cargas (b) para PC1 y PC2 de las propiedades fisicoquímicas de vino tinto tratadas con ultrasonidos con diferentes frecuencias.
3.3. Effect of temperature on TPC, EC, pH, TA, intensity and tint
According to , no significant changes were observed in pH. Nevertheless, the concentrations of TA slightly decreased with the increasing of temperature, and TA of sample treated at the highest temperature (60°C) was different from the CK and those treated at lower temperatures. In addition, the increase of temperature led to a slight increase of EC in the samples treated at 20°C and 30°C. From 30°C onwards, EC of wine samples decreased when increasing treatment temperature. In general, the wine EC was increased after ultrasonic treatment. TPC decreased with the increasing of temperature during ultrasonication. The CC changed but again in an erratic and minor way.
Table 3. Effect of temperature during sonication on physicochemical properties of wine.
Tabla 3. Efecto de la temperatura durante el tratamiento con ultrasonidos en las propiedades fisicoquímicas del vino.
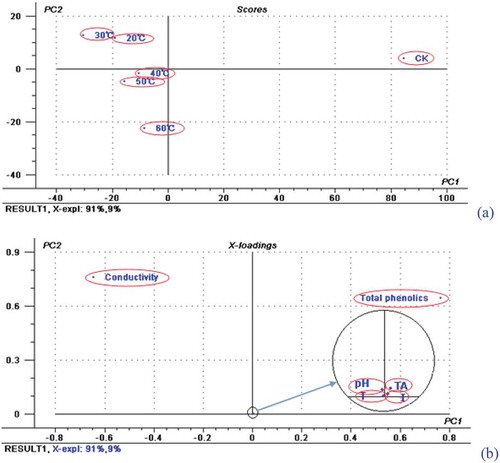
Regarding PCA, PC1 and PC2 accounted for 91% and 9% of total variation, respectively. The untreated wine presented positive score for PC1 while sonicated wines presented negative ones (). The best explained variances in PC1 and PC2 were described by the attributes of TPC, and TPC and EC, respectively.
Figure 3. Scores plot (a) and loadings plot (b) for PC1 and PC2 of samples sonicated at different temperatures.
Figura 3. Gráfico de resultados (a) y gráfico de cargas (b) para PC1 y PC2 de las muestras tratadas con ultrasonidos a diferentes temperaturas.
3.4. Effect of ultrasound exposure time on TPC, EC, pH, TA, intensity and tint
demonstrated that all the ultrasonic-treated samples were clearly distinguished and significantly different from each other. There was no major difference between the wines treated for 20 and 40 min, and 80 and 100 min, respectively (). PC1 accounted for 95% of the variation, and PC2 explained an additional 5%. The best explained variance in PC1 was described by the attribute of TPC. Furthermore, TPC also had the highest loading in PC2. Therefore, TPCs were more affected than the other physicochemical properties studied in describing the samples in this PCA.
Figure 4. Biplot (a and b) of PC1 vs. PC2 of wine samples subjected to sonication at different ultrasound exposure times.
Figura 4. Diagrama de dispersión biespacial (a y b) de PC1 frente a PC2 de las muestras de vino sujetas al tratamiento con ultrasonidos a diferentes tiempos de exposición ultrasónica.
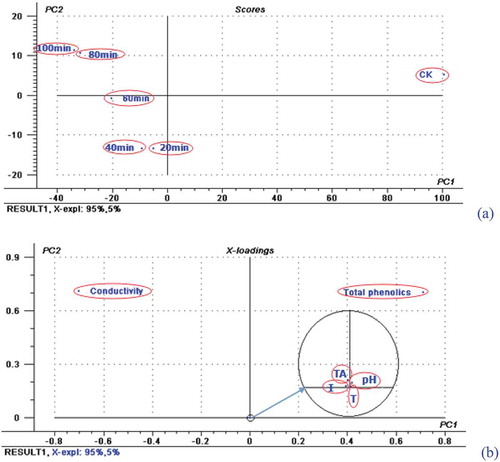
Table 4. Effect of ultrasound exposure time on physicochemical properties of wine.
Tabla 4. Efecto del tiempo de exposición ultrasónica en las propiedades fisicoquímicas del vino.
3.5. Effects of ultrasound on the chromatic characteristics of red wine
As shown in , significant changes of L*, a* and b* were observed in wines treated by ultrasound. Regarding the ultrasonic frequency, the wine treated with 80 kHz had the highest values of L*, a* and b* and the largest ΔE* as well. As regards the effect of ultrasonic power, results showed that the wine sonicated with the conditions of 240 W, 100 kHz and 20°C had the highest values of L*, a*, b* and ΔE*. In terms of ultrasound exposure time and temperature, the ultrasound conditions leading the highest value of L*, a*, b* and ΔE* are exposure time of 80 min and temperature of 20°C.
Table 5. Effect of ultrasonic treatment on the chromatic characteristics of wine.
Tabla 5. Efecto del tratamiento ultrasónico en las características cromáticas del vino.
3.6. Effect of ultrasound on DPPH-free radical scavenging activity of red wine
The effect of ultrasound irradiation on the DFRSA of red wine is shown in . Ultrasonic frequency did affect the scavenging activity of DPPH, and it decreased when increasing the ultrasonic frequency from 45 to 80 kHz, followed by an increase at 100 kHz. The lowest value was 93.02% using 80-kHz ultrasound.
Table 6. Effect of ultrasound irradiation on the DPPH free radical scavenging activity of wine.
Tabla 6. Efecto de la irradiación ultrasónica en el DPPH de actividad de eliminación de radicales libres del vino.
Ultrasound powers of 120, 150, 180, 240, 270 and 300 W were used to study their effects on the DFRSA of wine, while the other working conditions were of 100 kHz, 20 min and 20°C. Statistical results showed that ultrasonic power ranging from 240 to 300 W did not influence the DFRSA. Additionally, it was worth mentioning that ultrasound power of 240 W provoked the maximum scavenging activity among all the powers employed. The correlation between TPC and DPPH scavenging activity was performed, and the coefficient correlation was 0.539. Regarding the ultrasound exposure time and temperature, similar patterns were observed about the effects of ultrasound on the DPPH scavenging activity of wine, and ultrasound irradiation did influence the DPPH scavenging activity of wine.
4. Discussion
First at all, it is worth mentioning that PCA result showed that the untreated wine was very well differentiated from ultrasonically treated wines in PC1 dimension under all the assayed conditions (–). The effects of ultrasound in the analyzed physicochemical parameters are discussed in the following.
4.1. Effect of ultrasound on pH and TA of red wine
As mentioned earlier, the different assayed combinations of ultrasound power, frequency and exposure time did not exert any appreciable effects on pH and TA of wine. Regarding TA, similar results were also observed in maize wine (Chang, Citation2004) and in rice alcoholic beverage (Chang, Citation2005) treated with 20 and 1.6-MHz ultrasound, respectively. These results are also in agreement with the observations by Adekunte, Tiwari, Cullen, Scannell, and O’Donnell (Citation2010), Tiwari, Muthukumarappan, O’Donnell, and Cullen (Citation2008) and Aadil, Zeng, Han, and Sun (Citation2013). By contrast, we found that temperature had the ability to influence the concentrations of TA (). It was probably due to the volatilization rate constants of volatile acidity, which increased with temperature thus changing TA. Consequently, the increasing volatilization of acidity led to the decreasing of TA and the increasing of pH.
4.2. Effect of ultrasound on EC of red wine
Generally, the EC of liquid food is considered to be correlated to nutrients like vitamins, minerals, fatty acids and proteins (Martín, Zhang, Castro, Barbosa-Cánovas, & Swanson, Citation1994). Significant increases were observed in EC of wine after ultrasonic treatment, which might be attributed to the chemical effects of ultrasound, i.e. the acoustic cavitation in aqueous solution. The instant local high temperatures (>5000°C) and pressures (>1000 atmospheres) (Kanthale, Gogate, Pandit, & Marie Wilhelm, Citation2003; Suslick, Hammerton, & Cline, Citation1986) of collapsing gas bubbles lead to the dissociation of water vapor into hydroxyl radical and hydrogen radicals (Riesz & Kondo, Citation1992), which has the potential to make red wine more conductive. Consequently, the increase in EC was probably due to the chain of chemical reactions initiated by radicals and anions from ultrasonic radiation (Castellanos, Reyman, Sieiro, & Calle, Citation2001).
4.3. Effect of ultrasound on TPC of red wine
Phenolic compounds are beneficial and important to health as they play a significant role in reducing the risk of many diseases originating from the oxidative stress in the human body (Arts & Hollman, Citation2005; Duthie et al., Citation2006; Pace-Asciak, Hahn, Diamandis, Soleas, & Goldberg, Citation1995; Vinson & Hontz, Citation1995). As shown in , the changes of TPC were a bit erratic, which is in accordance with the results reported by Singleton and Draper (Citation1963). One explanation for these erratic changes could be that the natural aging is totally different from the ultrasound-assisted aging in practice. Generally, the former is a natural and gradual oxidizing process involving oxygen reacting with the most readily oxidizable wine constituents, resulting in physicochemical changes involving antioxidants, astringency, bitterness, browning reactions, color, protein constituents, etc. For the latter, without oxygen participation, the local instantaneous high temperatures and high pressures made the changes occurring in wines more complicated during ultrasonication. It is known that ultrasound can induce the formation of OH radicals in water (Fang, Mark, & Von Sonntag, Citation1996; Henglein, Citation1987; Riesz & Kondo, Citation1992), which would make changes even more complicated. Considering the heterogeneity of natural phenols, the possibility of interference from other readily oxidized or ultrasonically degraded substances, and the relative lower selectivity (because of the reactivity of non-phenolic constituents with the phosphomolybdate-tungstate reagent) for TPC determination by Folin–Ciocalteau method (Rapisarda et al., Citation1999), maybe the erratic of total phenolics can be accepted during ultrasonic treatment. Previous researches by Aadil et al. (Citation2013), Bhat, Kamaruddin, Min-Tze, and Karim (Citation2011) and Masuzawa et al. (Citation2000) reported an increase of TPC after sonication, but we found the opposite. Zhang et al. (Citation2015) reported that ultrasound could lead to degradation of phenols in ethanolic solvent. Red wine is actually an ethanolic solution, a high volatile solvent. During sonication, when ethanol is present, its volatility affects its concentration in the cavitation bubble generated by sonication, which means that the concentration in the bubble is lower. With the ultrasonic treatment, more free radicals will be produced by the bubble collapsed in high volatility solvent with low heat of vaporization and thus leading to phenolic compounds degradation (Zhang et al., Citation2015).
4.4. Effect of ultrasound on chromatic characteristics of red wine
CC of wine like tint and intensity are a visual indicator to judge the quality of red wine and affect consumer’s satisfaction, which are also related to the aging process since color intensity of red wine decreases during aging while tint increases (García Martín & Sun, Citation2013). The phenolic composition of red wine affects its color, so the aforementioned changes of phenolic compound could explain the tiny changes of CC. Similar chromatic changes were previously reported in sonicated grape juice (Aadil et al., Citation2013) and guava juice (Cheng, Soh, Liew, & Teh, Citation2007). Regarding CIELab parameters, L*, a quantitative component of the color, clearly increases with the aging of red wines (García Martín & Sun, Citation2013; Heras-Roger, Pomposo-Medina, Díaz-Romero, & Darias-Martín, Citation2014). Generally, the coordinate b* also increases while there is a slight decrease in the coordinate a* during natural aging (García Martín & Sun, Citation2013). Ultrasound increased the three coordinates except for the experiments carried out at temperatures above 20°C. The increase of a*, instead of being just the opposite that occurs during wine aging, could be regarded as a promising result. Red wine producers are currently looking for technologies that enhance the redness of wine, avoiding the browning and loss of color intensity that occur during aging. Finally, the overall colorimetric differences with respect the control wine were calculated in order to assess whether the changes in color promoted by ultrasound were noticeable. The theoretical limit of perception for the human eye (ΔE* = 3) has been suggested as an absolute color discrimination threshold for red wines (García Martín & Sun, Citation2013). Although no pattern was found, ΔE* values were close to this threshold after sonication. In general, all the wines treated at 20°C with different ultrasound powers, frequencies and exposure time had noticeable ΔE values (). By contrast, red wines treated at temperatures above 20°C led to lower colorimetric differences (between 1.0 and 1.5).
4.5. Effect of ultrasound on DPPH-free radical scavenging activity of red wine
In red wine and fruit juice, phenolic compounds are the major components responsible for DFRSA. Researchers (Fernández-Pachón, Villaño, Garcı́a-Parrilla, & Troncoso, Citation2004; Lucena et al., Citation2010; Sánchez-Moreno, Larrauri, & Saura-Calixto, Citation1999) have pointed out that the TPC concentration is closely related to antioxidant activity, and our results are in accordance with their findings, hence confirming the role of phenolic compounds in the antioxidant activity of wine. Significant changes in the DPPH scavenging activity were related to changes in the concentration of TPC induced by ultrasound.
5. Conclusions
Ultrasonic treatment performed at different ultrasound powers, frequencies, exposure times and temperatures significantly changed the concentration of TPC and EC of the red wine, while no significant effect on pH and TA was detected. Small differences in CC were also observed, and the overall colorimetric difference in relation to the untreated wine reached 2.8 units. PCA of the physicochemical properties of wines confirmed that ultrasound modified the characteristics of red wine and resulted in an effective clustering of wines into two groups: the ultrasonic treated wines and the untreated wine. PCA also suggested that ultrasonic frequency and exposure time have the greatest influence on EC and TPC, respectively. The current study proved that ultrasound can change some physicochemical properties of red wine. Based on the results obtained in this article, the conditions suggested for the application of ultrasound in red wine processing are 240 W power ultrasound, 80 kHz frequency, temperature equal to 20°C and 80 min exposure time. Nevertheless, further research is needed on a wider range of wine quality parameters to assess whether ultrasound positively modifies red wine quality.
Disclosure statement
No potential conflict of interest was reported by the authors.
ORCID
Juan Francisco García-Martín ![]() http://orcid.org/0000-0002-4582-560X
http://orcid.org/0000-0002-4582-560X
Additional information
Funding
References
- Aadil, R. M., Zeng, X.-A., Han, Z., & Sun, D.-W. (2013). Effects of ultrasound treatments on quality of grapefruit juice. Food Chemistry, 141, 3201–3206. doi:10.1016/j.foodchem.2013.06.008
- Adekunte, A. O., Tiwari, B. K., Cullen, P. J., Scannell, A. G. M., & O’Donnell, C. P. (2010). Effect of sonication on colour, ascorbic acid and yeast inactivation in tomato juice. Food Chemistry, 122, 500–507. doi:10.1016/j.foodchem.2010.01.026
- Arts, I. C., & Hollman, P. C. (2005). Polyphenols and disease risk in epidemiologic studies. The American Journal of Clinical Nutrition, 81, 317–325.
- Bhat, R., Kamaruddin, N. S. B. C., Min-Tze, L., & Karim, A. A. (2011). Sonication improves kasturi lime (Citrus microcarpa) juice quality. Ultrasonics Sonochemistry, 18, 1295–1300. doi:10.1016/j.ultsonch.2011.04.002
- Castellanos, M. M., Reyman, D., Sieiro, C., & Calle, P. (2001). ESR-spin trapping study on the sonochemistry of liquids in the presence of oxygen. Evidence for the superoxide radical anion formation. Ultrasonics Sonochemistry, 8, 17–22. doi:10.1016/S1350-4177(99)00047-4
- Chang, A. C. (2004). The effects of different accelerating techniques on maize wine maturation. Food Chemistry, 86, 61–68. doi:10.1016/j.foodchem.2003.08.010
- Chang, A. C. (2005). Study of ultrasonic wave treatments for accelerating the aging process in a rice alcoholic beverage. Food Chemistry, 92, 337–342. doi:10.1016/j.foodchem.2004.07.027
- Chang, A. C., & Chen, F. C. (2002). The application of 20 kHz ultrasonic waves to accelerate the aging of different wines. Food Chemistry, 79, 501–506. doi:10.1016/S0308-8146(02)00226-1
- Cheng, L. H., Soh, C. Y., Liew, S. C., & Teh, F. F. (2007). Effects of sonication and carbonation on guava juice quality. Food Chemistry, 104, 1396–1401. doi:10.1016/j.foodchem.2007.02.001
- Duthie, S. J., Jenkinson, A. M., Crozier, A., Mullen, W., Pirie, L., Kyle, J., … Duthie, G. G. (2006). The effects of cranberry juice consumption on antioxidant status and biomarkers relating to heart disease and cancer in healthy human volunteers. European Journal of Nutrition, 45, 113–122. doi:10.1007/s00394-005-0572-9
- Fang, X., Mark, G., & Von Sonntag, C. (1996). OH radical formation by ultrasound in aqueous solutions Part I: The chemistry underlying the terephthalate dosimeter. Ultrasonics Sonochemistry, 3, 57–63. doi:10.1016/1350-4177(95)00032-1
- Fernández-Pachón, M. S., Villaño, D., Garcı́a-Parrilla, M. C., & Troncoso, A. M. (2004). Antioxidant activity of wines and relation with their polyphenolic composition. Analytica Chimica Acta, 513, 113–118. doi:10.1016/j.aca.2004.02.028
- García Martín, J. F., & Sun, D.-W. (2013). Ultrasound and electric fields as novel techniques for assisting the wine ageing process: The state-of-the-art research. Trends in Food Science & Technology, 33, 40–53. doi:10.1016/j.tifs.2013.06.005
- Henglein, A. (1987). Sonochemistry: Historical developments and modern aspects. Ultrasonics, 25, 6–16. doi:10.1016/0041-624X(87)90003-5
- Heras-Roger, J., Pomposo-Medina, M., Díaz-Romero, C., & Darias-Martín, J. (2014). Copigmentation, colour and antioxidant activity of single-cultivar red wines. European Food Research and Technology, 239, 13–19. doi:10.1007/s00217-014-2185-0
- Kanthale, P. M., Gogate, P. R., Pandit, A. B., & Marie Wilhelm, A. (2003). Mapping of an ultrasonic horn: Link primary and secondary effects of ultrasound. Ultrasonics Sonochemistry, 10, 331–335. doi:10.1016/S1350-4177(03)00104-4
- Lucena, A. P. S., Nascimento, R. J. B., Maciel, J. A. C., Tavares, J. X., Barbosa-Filho, J. M., & Oliveira, E. J. (2010). Antioxidant activity and phenolics content of selected Brazilian wines. Journal of Food Composition and Analysis, 23, 30–36. doi:10.1016/j.jfca.2009.08.004
- Martín, O., Zhang, Q., Castro, A. J., Barbosa-Cánovas, G. V., & Swanson, B. G. (1994). Empleo de pulsos eléctricos de alto voltaje para la conservación de alimentos. Microbiología e ingeniería del proceso. Revista española de ciencia y tecnología de alimentos, 34, 1–34.
- Masuzawa, N., Ohdaira, E., & Ide, M. (2000). Effects of ultrasonic irradiation on phenolic compounds in wine. Japanese Journal of Applied Physics, 39, 2978–2979. doi:10.1143/JJAP.39.2978
- Pace-Asciak, C. R., Hahn, S., Diamandis, E. P., Soleas, G., & Goldberg, D. M. (1995). The red wine phenolics trans-resveratrol and quercetin block human platelet aggregation and eicosanoid synthesis: Implications for protection against coronary heart disease. Clinica Chimica Acta, 235, 207–219. doi:10.1016/0009-8981(95)06045-1
- Rapisarda, P., Tomaino, A., Lo Cascio, R., Bonina, F., De Pasquale, A., & Saija, A. (1999). Antioxidant effectiveness as influenced by phenolic content of fresh orange juices. Journal of Agricultural and Food Chemistry, 47, 4718–4723. doi:10.1021/jf990111l
- Riesz, P., & Kondo, T. (1992). Free radical formation induced by ultrasound and its biological implications. Free Radical Biology and Medicine, 13, 247–270. doi:10.1016/0891-5849(92)90021-8
- Sánchez-Moreno, C., Larrauri, J. A., & Saura-Calixto, F. (1999). Free radical scavenging capacity of selected red, rose and white wines. Journal of the Science of Food and Agriculture, 79, 1301–1304. doi:10.1002/(SICI)1097-0010(19990715)79:10<1301::AID-JSFA367>3.0.CO;2-Y
- Singleton, V. L., & Draper, D. E. (1963). Ultrasonic treatment with gas purging as a quick aging treatment for wine. American Journal of Enology and Viticulture, 14, 23–35.
- Suslick, K. S. (1998). Kirk-Othmer encyclodpedia of chemical technology (4th ed., pp. 516–541). New York, NY: John Wiley & Sons.
- Suslick, K. S., Hammerton, D. A., & Cline, R. E. (1986). Sonochemical hot spot. Journal of the American Chemical Society, 108, 5641–5642. doi:10.1021/ja00278a055
- Tao, Y., García, J. F., & Sun, D.-W. (2014). Advances in wine aging technologies for Enhancing wine quality and accelerating wine aging process. Critical Reviews in Food Science and Nutrition, 54, 817–835. doi:10.1080/10408398.2011.609949
- Tiwari, B. K., Muthukumarappan, K., O’Donnell, C. P., & Cullen, P. J. (2008). Effects of sonication on the kinetics of orange juice quality parameters. Journal of Agricultural and Food Chemistry, 56, 2423–2428. doi:10.1021/jf073503y
- Vinson, J. A., & Hontz, B. A. (1995). Phenol antioxidant index: Comparative antioxidant effectiveness of red and white wines. Journal of Agricultural and Food Chemistry, 43, 401–403. doi:10.1021/jf00050a027
- Zhang, Q.-A., Fan, X.-H., Zhao, W.-Q., Wang, X.-Y., & Liu, H.-Z. (2013). Evolution of some physicochemical properties in Cornus officinalis wine during fermentation and storage. European Food Research and Technology, 237, 711–719. doi:10.1007/s00217-013-2045-3
- Zhang, Q.-A., Shen, H., Fan, X.-H., Shen, Y., Wang, X., & Song, Y. (2015). Changes of gallic acid mediated by ultrasound in a model extraction solution. Ultrasonics Sonochemistry, 22, 149–154. doi:10.1016/j.ultsonch.2014.06.010