
ABSTRACT
In this work, the effect of the thermosonication (TS) on the inactivation of Escherichia coli and Staphylococcus aureus in soursop nectar was evaluated, as well as the quality and stability of the nectar during its storage at 4°C. A reduction of 4.5–5 log CFU/mL was achieved with the TS treatment (24 kHz, average temperature of 50–51°C, acoustic energy density of 1.3–1.4 W/mL for 10 min) in both pathogens. Likewise, thermosonicated nectar retained 85% of ascorbic acid, polyphenol oxidase inactivation and microbiological and physicochemical stability during 30 days at 4°C. Sensorially, the thermosonicated nectar was predominantly preferred over a commercial one. TS is a viable alternative to extend the shelf life of minimally processed soursop nectar.
RESUMEN
En este trabajo se evaluó el efecto de la termosonicación sobre la inactivación de Escherichia coli y Staphyloccocus aureus en néctar de guanábana; así como la calidad y estabilidad del néctar durante su almacenamiento a 4°C. Se logró una reducción de 4,5–5,0 log CFU/mL con el tratamiento de termosonicación (24 kHz, temperatura promedio de 50–51°C, densidad de energía acústica de 1,3–1,4 W/mL, durante 10 min) en ambos patógenos. Del mismo modo, el néctar termosonicado conservó el 85% de ácido ascórbico, la inactivación de polifenol oxidasa y la estabilidad microbiológica y fisicoquímica durante 30 días a 4°C. Sensorialmente, el néctar termosonicado fue predominantemente preferido sobre un néctar comercial. La termosonicación es una alternativa viable para extender la vida útil del néctar de guanábana mínimamente procesado.
1. Introduction
Thermosonication (TS) is a technology that combining cavitation (ultrasound) with heat produces an additive effect that greatly increases bacterial and enzymatic inactivation compared to thermal pasteurization (Cruz, Vieira, Fonseca, & Silva, Citation2011). According to the FDA (Citation2004), any technology that is applied for the preservation of juices and nectars must be able to reduce at least 5 logs (vegetative cells) of the target microorganism.
Some of the microorganisms studied when applying TS in fruit juices include Escherichia coli O157H:7 (Muñoz et al., Citation2012), Salmonella Enteritidis (Kiang, Bhat, Rosma, & Cheng, Citation2013) and Staphylococcus aureus (Walkling-Ribeiro et al., Citation2009) among others. Most of the authors reported that they complied with the FDA stipulation, attributing this behavior to the intracellular cavitation, which produces disruption of the structure and function of the cell wall. Additionally, it has been reported that TS applied to grape juice (Aadil et al., Citation2015), purple cactus pear juice (Cruz-Cansino et al., Citation2015) and carrot juice (Jabbar et al., Citation2015; Martínez-Flores, Garnica-Romo, & Bermúdez-Aguirre, Citation2015) allowed to maintain high levels of bioactive compounds. In our laboratory, we have reported that TS treatment of soursop nectar at 54°C decreased the polyphenol oxidase (PPO) activity among 91% and 99% (Anaya-Esparza et al., Citation2017b).
Although it has been shown that TS at the time of application is effective for the treatment of fruit-based juices and nectars, there are few studies on the conservation of their quality during storage. Therefore, the objective of this study was to evaluate the lethal effect of TS on two microorganisms considered as pathogenic bacteria by surface-response methodology, as well as the quality and stability of the thermosonicated soursop nectar during storage in refrigeration.
2. Materials and methods
The development of the research was carried out in two stages. The initial stage was conducted to evaluate the lethal effect of TS in different conditions on E. coli ATCC 8739 and S. aureus ATCC 33862, while the final stage consisted of monitoring the quality and stability of the thermosonicated nectar during storage at 4°C. Bacterial strains were purchased from Microbiologics® (Minnesota, USA) and rehydrated according to the instructions of the manufacturer.
2.1. Samples and treatments
Nectars were prepared according to the requirements of the Codex Alimentarius for fruit juices and nectars (CODEX STAN 247-2005). The pulp was diluted with purified water (350 g/L); subsequently, the mixture was homogenized and adjusted with sucrose (50 g/L). Nectar samples were treated by discontinuous TS (batch process) as schematized () (Anaya-Esparza et al., Citation2017a), using an ultrasound (Hielsher UP400S, Teltow, Germany) at 400 W, with constant frequency of 24 ± 1 kHz, coupled with a shaking water bath (Thermo Scientific 2870, Ohio, USA) to maintain a constant temperature. A fractionated factorial design 33−1 was used, considering as factors at different levels: acoustic energy density (AED) (1.1, 1.2 and 1.4 W/mL), average temperature between initial and final temperature (34, 44 and 54°C) and time (2, 6 and 10 min) to obtain a total of nine treatments (). For each treatment, 200 mL of soursop nectar was placed in a 250-mL beaker.
Figure 1. Schematic diagram of thermosonication treatment to laboratory scale used in this study.
Figura 1. Diagrama esquemático del tratamiento de termosonicación a escala de laboratorio usado en este estudio.
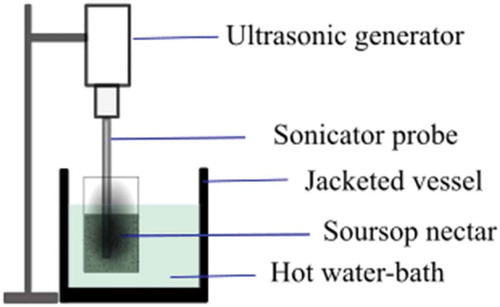
Table 1. Experimental matrix and treatments (TS1–TS9) and lethal and sublethal effects of thermosonication on Escherichia coli and Staphylococcus aureus inoculated in soursop nectar.
Tabla 1. Matriz experimental y tratamientos (TS1-TS9) y efectos letal y subletal de la termosonicación sobre Escherichia coli y Staphylococcus aureus inoculadas en néctar de guanábana.
2.2. Lethal and sublethal damage of TS on E. coli and S. aureus
Cell suspension and inoculation of E. coli and S. aureus in the nectars were performed, as recommended by Briñez, Roig-Sagués, Hernández and Guamis (Citation2006). Previously, cryobeads were prepared inoculating strain culture separately (E. coli or S. aureus) in tryptone soy broth (DIBICO Mexico City, Mexico) and stored at −20°C to provide stock cultures for the assays. Before each experiment, one cryobead (2 mL) was inoculated into 10 mL of tryptone soy broth and incubated at 37°C for 24 ± 2 h. After incubation, the broth was spread using a disposable loop in a Petri dish with tryptone soy agar (TSA) (DIBICO Mexico City, Mexico) incubated at 37°C for 24 ± 2 h. Subsequently, cell suspension was prepared adding enough inoculum of bacteria (E. coli or S. aureus) in 11 mL of sterile peptone water (0.1%). The final concentration (9.0 ± 0.1 log CFU/mL) of cell suspension was determined using a spectrophotometer (Jenway 6705 spectrophotometer, Felsted, UK) when absorbance was 2.0 ± 0.5 at 405 nm. The nectar was inoculated with cell suspension (10 mL/L) and homogenized. Lethal and sublethal injury in bacterial strains were assessed by serial dilution using pour plate methods. Ten milliliters of each treatment were placed into 90 mL of sterile peptone water and homogenized. Serial dilutions (up to 10−7) were made in sterile peptone water (9 mL) with samples (1 mL) taken before TS treatment; then, 1 mL of diluted aliquots was plated in TSA by pour-plated method and incubated at 37°C for 24 h. Procedure described above comes next TS and was repeated for each treatment (TS1–TS9). Results were expressed as log CFU/mL. Lethality was calculated as the difference between the logarithms of colony counts in TSA before (approximately 7.1 ± 0.2 log CFU/mL) and after TS treatment (log No–log N). Also, to detect the bacterial cell injury, dilutions of TS samples were pour-plated in TSA added with 2% sodium chloride and incubated at 37°C for 24 h (García, Gómez, Condón, Raso, & Pagán, Citation2003; Maldonado, Aguilar, Carvajal, González, & Klotz, Citation2011). Sublethal damage was calculated per the difference obtained from the counts between the cultures in TSA (before treatment) and TSA + NaCl for each treatment (TS1–TS9) and expressed as percentage according to the following equation (García et al., Citation2005):
Procedure described above was followed with E. coli and S. aureus one by one.
2.3. Evaluation of quality and stability of soursop nectar during storage in refrigeration
From the data of the first stage (analyzed with response surface methodology [RSM]) and after obtaining the best experimental conditions of TS (24 ± 1 kHz, 1.4 W/mL, 51°C and 10 min), the nectar was treated again under these TS conditions (TSN). A control-unpasteurized nectar (UPN) was used. The TSN nectars after being treated were cooled to 30 ± 2°C in a cold-water bath and, subsequently, nectars were stored at 4°C prior to analyses. Samples were analyzed at 0, 5, 15, 30 and 45 days, considering the beginning of the preparation as day 0.
2.3.1. Microbiological stability
Microbial counting for aerobic mesophilic bacteria (AMB), yeast and molds was performed according to the Bacteriological Analytical Manual (FDA, Citation2001a; Citation2001b; respectively). One milliliter of the homogenized sample was 10-fold serially diluted using sterile peptone water, and 0.1 mL of the appropriate dilutions was pour-plated into appropriate selective media. Samples (1 mL) were taken immediately after processing and during shelf-life analysis of nectars. AMB count was determined using plate count agar, cultures were incubated at 35°C for 48 h, for yeast and molds, potato dextrose agar was used; dishes were incubated at 25°C for 5 days. Samples were also pour-plate in violet red bile glucose for Coliform bacteria count and incubated at 35°C for 24 h (Cruz et al., Citation2007; FDA, Citation2001c). Results were expressed as log colony-forming units per milliliter of nectar (log CFU/mL). Culture media were prepared according to the instructions of the manufacturer (DIBICO Mexico City, Mexico).
2.3.2. PPO activity and residual enzymatic activity
Enzymatic extraction of PPO was done according to the method described by Bora, Holschuh and da Silva (Citation2004). Results were expressed as specific activity of PPO (SAPPO, U/mg protein). Total protein concentration (mg) was determined by the Bradford method (Bradford, Citation1976). Residual enzymatic activity of PPO (PPORA) was calculated and expressed as percentage (Fonteles et al., Citation2012).
2.3.3. pH, titratable acidity, total soluble solids, nonenzymatic browning index and color
The pH (Method 981.12), titratable acidity (TA) (942.15) and total soluble solids (TSS) (932.12) were determined according to the methods of AOAC (Citation2005). The nonenzymatic browning index (NEBI) was measured spectrophotometrically at 420 nm following the methodology proposed by Meydav, Saguy and Kopelman (Citation1977). The color was quantified using a colorimeter (Konica Minolta, CR300, Osaka, Japan).
2.3.4 Ascorbic acid
The ascorbic acid (AA) content was measured spectrophotometrically following the method of Rahman, Mizanur and Khan (Citation2007). Results were expressed as gram of AA per liter of nectar (g AA/L).
2.3.5. Total soluble polyphenols
For the aqueous–organic extraction, we follow the methodology proposed by Pérez-Jiménez et al. (Citation2008). The total soluble polyphenols (TSP) content was quantified in the extracts by the Follin–Ciocalteau method at 750 nm (Montreau, Citation1972). The concentration was obtained by performing a calibration curve with gallic acid (standard). The results were reported as milligrams of gallic acid equivalents per 100 mL of nectar (mg GAE/100 mL).
2.3.6. Antioxidant capacity
From the aqueous–organic extracts of the soluble polyphenols, the antioxidant capacity (AC) was quantified by the ABTS (2,2-azinobis-3-ethylbenzothiazoline-6-sulfonic acid) test (Re et al., Citation1999), DPPH (2,2-diphenyl-1-picrylhydrazyl) test (Prior, Wu, & Schaich, Citation2005) and the ferric-reducing antioxidant power (FRAP) test following the methodology of Benzie and Strain (Citation1996). The results were expressed as millimoles of Trolox (6-hydroxy-2,5,7,8-tetramethylchroman-2-carboxylic acid) equivalents per milliliter of nectar (mmoL Trolox equivalents/mL).
2.4. Sensory evaluation
The evaluated nectars were the TSN after 30 days of storage at 4°C, UPN (freshly prepared) and a commercial soursop nectar (CN). Acceptance tests (color, taste, odor and overall impression) were performed with a panel of 100 untrained judges (Pedrero & Pangborn, Citation1997).
2.5. Statistical analysis
In the first stage, RSM was used. In the second stage, the experiment was conducted in a factorial completely randomized design 3 × 5. The analysis was performed using an analysis of variance (p < 0.05) with STATISTICA v.10 (StatSoft, Tulsa, Oklahoma, USA) software. Differences between means were compared using the Tukey test (α = 0.05). Results were expressed as the mean ± SD of values obtained in triplicate from two different experiments.
3. Results and discussions
3.1. Lethal and sublethal effects of TS on E. coli and S. aureus
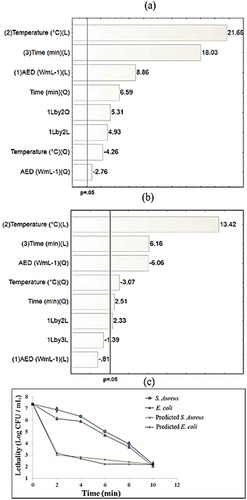
shows that all treatments exhibit a reduction of the plate count after TS (initial cell concentration was approximately 7.1 log CFU/mL for both microorganisms); the TS9 treatment was the only one that presented lethality above the stipulated (≥5 logs) by the FDA (Citation2004). Likewise, all treatments showed more than 99% sublethal damage, for both microorganisms. Similar results have been reported by Muñoz et al. (Citation2012) at conditions of 24 kHz, 50°C for 5 and 2.9 min in orange and apple juices, they achieved a reduction of 5.1 and 4.9 logs, respectively, using E. coli as indicator. Walkling-Ribeiro et al. (Citation2009), in orange juice (30 kHz, 30 min and 55°C), attained a reduction of 5.5 logs in S. aureus. Yusaf (Citation2014) mentioned that some microorganisms might be more susceptible than others to TS treatment. Also, shape or size of the microorganisms may affect the treatment efficiency, probably due to an increase of surface area. In our study, similar values in lethality between E. coli and S. aureus at the same TS treatment were detected. Results agree with Scherba, Weigel and Brien (Citation1991) who reported no differences on reduction range between gram-negative and gram-positive organisms when ultrasound was applied. Evelyn and Silva (Citation2016) have suggested that bacterial cells generally become more sensitive when they undergo TS, mainly due to the absorption of energy by the membranes providing a cumulative effect on the basic functions of the microorganism causing a weakening and/or disruption of the cell membrane, leading to cell lysis.
According to the response surface, the better treatment conditions that guarantee FDA compliance with soursop nectar are 1.37 W/mL at 51°C for 9.2 min with a lethality of 5.16 log CFU/mL for E. coli, while for S. aureus, the conditions are 1.4 W/mL at 50°C for 10 min with a lethality of 5.18 log CFU/mL. The regression model and the lethality on both microorganisms in soursop nectar can be predicted using the following polynomial equations (Equation (2): R2 = 0.98; Equation (3): R2 = 0.96, both with 95% confidence level):
where AED is the acoustic energy density (W/mL), T is the temperature (°C) and t is the treatment time (min).
The Pareto charts for E. coli ()) and S. aureus ()) show the effect of independent variables on lethality of bacteria at a confidence level of 95%, AED, time, temperature and interaction between AED and temperature for both microorganisms. Evelyn and Silva (Citation2016) observed that an increase of AED during TS treatment produced a lethality near sixfold compared to the thermal process at the same temperature. From the TS9 treatment, a microbial survival curve was elaborated for each pathogen and it was compared with the curve elaborated with the polynomial equation obtained in the response surface analysis for each microorganism, the comparisons are visualized ()) by plotting the observed data points and the predicted inactivation curves of the bacterium on the same graph. As can be seen, the actual log reductions are so different of the predicted ones for both bacteria. However, the tendency of the real and predicted survival curves is the same; moreover, the final log value (at 10 min) is the same for both curves and both microorganisms. These results can be explained by the fact that real food systems may influence the thermal resistance of microorganisms (Knorr et al., Citation2011), which the mathematical model does not consider, as described by Ávila-Sosa, Gastélum, López-Malo and Palou (Citation2010).
Figure 2. Pareto chart of the effect of the thermosonication on E. coli (a), S. aureus (b) and predicted/evaluated survival curve (c).
Figura 2. Diagrama de Pareto de efecto del termosonicado sobre E. coli (a) y S. aureus (b) y curva de supervivencia (c) predicha y evaluada.
3.2. Microbilogical stability
shows the microbiological counts during the shelf life of soursop nectars. Untreated soursop nectar (UPN) exhibits growth of AMB (1.97 log CFU/mL), Enterobacteria (1.10 log CFU/mL), molds (1.10 log CFU/mL) and yeast (1.65 log CFU/mL) from the day 0, in comparison with thermosonicated sample; this treatment did not show growth of microorganisms at the same time. The UPN from the day 5 of storage presented bubbling, which indicates that fermentation has occurred. Imade, Ikenebomeh, Obayagbona and Igiehon (Citation2013) have mentioned that there is a high content of endogenous yeasts that are responsible for the natural fermentation of soursop juice. UPN was not evaluated after 15 days due to visible spoilage and no further microbiological analyses were conducted as recommended by Martínez-Flores et al. (Citation2015).
Table 2. Microbiological counts in unpasteurized (UPN) and thermosonicated (TSN) soursop nectars, during storage at 4°C.
Tabla 2. Conteos microbiológicos en néctares de guanábana sin pasteurizar (UPN) y termosonicado (TSN), durante su almacenamiento a 4ºC.
The TSN after 30 days of storage at 4°C kept the microbiological counts sufficiently low to consider that the thermosonicated nectar has good microbiological quality because of accomplished criteria of the Codex Alimentarius (CAC/GL 21-1997), with 1.60 and 1.10 log CFU/mL for AMB and yeasts, respectively, without the presence of molds or coliforms. According to Wordon, Mortimer and Mcmaster (Citation2012) and Herceg et al. (Citation2013), microbial cells are more sensitive to TS compared to traditional thermal pasteurization, due to the combined effects of heat with ultrasound, which causes weakening, pore formation and/or rupture of the cell membrane, hindering their normal development. Although the inactivation effect of TS was more effective than traditional pasteurization, all microorganisms were not inhibited because there was fermentation after 45 days of storage, the count of AMB and yeast increased and coliforms were detected (Chapman, Ferguson, Consalo, & Bliss, Citation2013); however, 30 days of shelf life under refrigerated storage (4°C) temperature is enough time to sell a nectar that has been minimally processed.
3.3. PPO activity and residual enzymatic activity
A significant effect (p < 0.05) was observed for the type of treatment in SAPPO (). The UPN presented a SAPPO between 6.10 and 6.79 U/mg protein during storage time. On the other hand, TS reduced significantly (p < 0.05) SAPPO to 99% of the initial activity (0.16 U/mg protein) on the day of treatment application (Anaya-Esparza et al., Citation2017b), after that no PPO activity was detected during all the time of storage. The effect of TS on PPO activity can be attributed to the denaturation of the protein and the change in its structural conformation by the additive effect between cavitation and heat; the cumulative effect can be so effective that a total enzymatic inactivation is achieved, as was described by Sulaiman, Soo, Farid and Silva (Citation2015). Thus, it was demonstrated that the TS conditions evaluated in this experiment are effective in avoiding the enzymatic darkening in soursop nectar during its storage.
Table 3. Polyphenol oxidase (PPO) activity in unpasteurized (UPN) and thermosonicated (TSN) soursop nectars, during storage at 4°C.
Tabla 3. Actividad de la polifenoloxidasa en néctar de guanábana sin pasteurizar (UPN) y termosonicado (TSN), durante su almacenamiento a 4ºC.
3.4. pH, TA, TSS, NEBI and color
shows that changes in pH, TA and TSS were dependent on fermentation of nectars (). TA increased when UPN nectar was fermented, while pH and TSS decreased (p < 0.05); however, it is important to mention that in the TSN, TA was stable for 30 days of storage due to its greater microbiological stability (Shaheer et al., Citation2014).
Table 4. pH, titratable acidity, total soluble solids, nonenzymatic browning index (NEBI) and color attributes (L, a*, b* and ΔE) of unpasteurized (UPN) and thermosonicated (TSN) soursop nectars, during storage at 4°C.
Tabla 4. pH, acidez titulable, sólidos solubles totales, índice de oscurecimiento no enzimático (NEBI) y atributos de color (L, a*, b* y ΔE) del néctar de guanábana sin pasteurizar (UPN), y termosonicado (TSN), durante su almacenamiento a 4ºC.
The NEBI is considered a quality indicator in the processing of fruit drinks, as it provides data on loss of antioxidants via nonenzymatic reactions (Valdramidis, Cullen, Tiwari, & O’Donnell, Citation2010). From the fifth day of storage, NEBI increased significantly (p < 0.05) in UPN nectar (), due to the oxidation of AA and/or polyphenols as mentioned by Peters, Badrie and Comissiong (Citation2000). These authors observed an increase in NEBI in soursop nectar (unpasteurized and pasteurized) with respect to time and the appearing of brown pigmentation. In the TSN up to 45 days of cold storage, it presented a value of 0.022 absorbance units. There is the theory that TS removes oxygen from the environment where it is applied (Cheng, Soh, Liew, & Teh, Citation2007); therefore, the antioxidants can be kept more stable in a thermosonicated nectar; related results reported Cruz-Cansino et al. (Citation2015) in thermoultrasonicated purple cactus pear juice compared to the treated with pasteurization, mentioning that thermoultrasonication prevented NEBI for 28 days.
The changes in L, a* and b* were lower in TSN compared to UPN during cold storage (). These results are in concordance with the NEBI and ΔE values. The values of ΔE > 3.0 indicate perceptible changes in color by the consumer (Choi, Kim, & Lee, Citation2002). In this sense, unlike the UPN that presented a ΔE > 3.0 after 5 days of storage, the TSN maintained values of ΔE < 3.0 after 45 days of storage, which indicates a white color with values of L, a* and b* practically unchanged. Comparable results were also observed in ultrasonicated soursop juice (Dias et al., Citation2015); this means that TSN is stable in terms of enzymatic and nonenzymatic browning (Aadil et al., Citation2015).
3.5. AA content, TSP and AC
On the day of preparation of the nectars, the AA content was 35.68 and 34.48 mg/100 mL in UPN and TSN nectar, respectively (). The time of storage also affected (p < 0.05) the AA content, which decreased in all treatments during storage. The highest vitamin C loss was observed in the UPN after 3 days of storage (85%, 5.95 mg/100 mL); while in the TSN, only 15% (29.21 mg/100 mL) was lost. Some authors have reported percentage of AA retention greater than 90% and up to 100% when applied TS in fruit or vegetable juices (Abid et al., Citation2014; Martínez-Flores et al., Citation2015; Rawson et al., Citation2011), proposing that the stability of AA can be associated with the elimination of dissolved oxygen from the medium, essential for AA degradation, during the cavitation produced by the TS treatment (Cheng et al., Citation2007).
Table 5. Ascorbic acid (AA), total soluble polyphenols (TSP) and antioxidant capacity (ABTS, DPPH and FRAP) of unpasteurized (UPN) and thermosonicated (TSN) soursop nectars, on the day of preparation and at the end of the refrigerated storage.
Tabla 5. Ácido ascórbico (AA), polifenoles solubles totales (TSP) y capacidad antioxidante del néctar de guanábana sin pasteurizar (UPN), y termosonicado (TSN), en el día de su elaboración y al final de su almacenado en refrigeración.
Regarding the TSP content, the evaluated treatments also had a significant effect (p < 0.05). In the UPN, 348.79 mg GAE/100 mL were quantified. The TSN presented slight variability (1%, 349.99 mg GAE/100 mL) with respect to control nectar. Comparable results have also been reported when TS was applied in juices by Martínez-Flores et al. (Citation2015) for carrot juice (increase of 9%) and Rawson et al. (Citation2011) for watermelon juice (increase of 7%). It has been reported that the increase in TSP by TS is because phenols attached to carbohydrates (pectin, lignin, cellulose and hemicellulose) of the cell wall of vegetables are released, when it is broken by cavitation (Cui et al., Citation2014).
During storage, all treatments showed a decrease in the TSP content, with a loss of 14% (3 days) and 7% (30 days) for UPN and TSN, respectively. Similar effects in thermosonicated juices of purple cactus pear and carrot by Cruz-Cansino et al. (Citation2015) and Martínez-Flores et al. (Citation2015) have been reported. These authors showed that during storage, there is a gradual release of phenolic compounds and amino acids, caused by the senescence and decomposition of the cell structure, although extended periods of exposure of these compounds to oxygen can oxidize them. It was clear that TSN kept these compounds bioactive and available, for a longer time than pasteurized nectar.
AC was affected by storage time (p < 0.05). AC values for all the treatments decreased with the ABTS assay, from 22.02–22.66 to 14.19–17.43 mmoL/mL at the end of storage. The same was true for the DPPH and FRAP tests, the initial AC values (6.14–7.00 and 4.93–5.56 mmoL/mL, respectively) decreased to 0.37 and 3.95 mmoL/mL in the UPN and 4.08 and 4.55 mmoL/mL in the TSN. The results are in agreement with the decrease in TSP content. TSN had higher antioxidant values than the untreated control (UPN). It has been shown that polyphenols can act by multiple mechanisms to neutralize radicals such as chelating metals, transferring electrons or donating hydrogen ions. Differences in AC between trials can be attributed to different concentrations and type of polyphenols in the extract evaluated (Pérez-González, Rebollar-Zepeda, León-Carmona, & Galano, Citation2012).
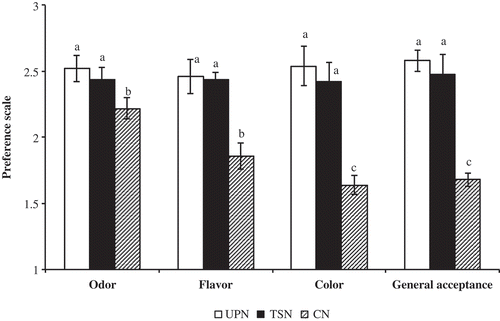
3.6. Sensory evaluation
The UPN and TSN received high scores in all attributes evaluated (). Regarding to the CN, the preservation treatment to which the nectar is subjected generates a darker color and diminishes the flavor of soursop although received higher score in terms of odor than the samples. Dias et al. (Citation2015) carried out a sensorial evaluation on untreated and ultrasonically treated soursop juice and there were not significant differences in the attributes of color, aroma and flavor.
Figure 3. Sensory evaluation of unpasteurized sousorp nectar on the day of preparation (UPN) and thermosinicated (TSN) after 30 days of storage at 4°C and a commercial nectar (CN). Values are the averages of triplicate determinations from two different experiments (n = 6) ± standard deviation (SD). Different lowercase letters indicate significant differences between treatments (p < 0.05).
Figura 3. Evaluación sensorial del néctar de guanábana en el día de su elaboración, sin pasteurizar (UPN) y termosonicado (NTS) después de 30 días de almacenamiento a 4ºC, y un néctar comercial (CN). Los valores son promedio de tres determinaciones de dos diferentes experimentos (n = 6) ± desviación estándar (SD). Letras minúsculas distintas indica diferencias significativas entre tratamientos (p < 0,05).
4. Conclusions
The TS applied in this work turned out to be a viable technology for the processing of soursop nectar with microbiological stability, inactivation of the PPO and a greater retention of bioactive compounds during the storage at 4°C for 30 days. In addition, the TSN presented better sensory attributes than the CN; therefore, it is a good alternative to extend the shelf life of minimally processed soursop nectar. Nevertheless, further studies are required to establish the most effective conditions that can prolong the shelf life of soursop-based beverages.
Acknowledgments
The authors acknowledge at Sr. Hiram Salcedo Pérez by soursop fruit donation.
Disclosure statement
The authors have declared that no conflict of interest exists.
Additional information
Funding
References
- Aadil, R.M., Zeng, X.A., Zhang, Z.H., Wang, M.S., Han, Z., Jing, H., & Jabbar, S. (2015). Thermosonication: A potential technique that influences the quality of grapefruit juice. International Journal of Food Science & Technology, 50, 1275–1282. doi:10.1111/ijfs.12766
- Abid, M., Jabbar, S., Hu, B., Hashim, M.M., Wu, T., Lei, S., & Zeng, X. (2014). Thermosonication as a potential quality enhancement technique of apple juice. Ultrasonics Sonochemistry, 21, 984–990. doi:10.1016/j.ultsonch.2013.12.003
- Anaya-Esparza, L.M., Velázquez-Estrada, R.M., Roig, A.X., García-Galindo, H.S., Sayago-Ayerdí, S.G., & Montalvo-González, E. (2017a). Thermosonication: An alternative processing for fruit and vegetable juices. Trends in Food Science and Technology, 61, 26–37. doi:10.1016/j.tifs.2016.11.020
- Anaya-Esparza, L.M., Velázquez-Estrada, R.M., Sayago-Ayerdi, S.G., Sánchez-Burgos, J.A., Ramírez-Mares, M.V., De Lourdes García-Magaña, M., & Montalvo-González, E. (2017b). Effect of thermosonication on polyphenol oxidase inactivation and quality parameters of soursop nectar. LWT-Food Science and Technology, 75, 545–551. doi:10.1016/j.lwt.2016.10.002
- AOAC. (2005). Official methods of analysis of association official of agricultural chemists international (15th ed.). Horwitz W, Latimer G. (editors). Washington (DC): AOAC.
- Ávila-Sosa, R., Gastélum, G.G., López-Malo, A., & Palou, E. (2010). Modelización de la inactivación termosónica de Staphylococcus aureus, un enfoque multifactorial. Cyta - Journal of Food, 8, 177–183. doi:10.1080/19476330903335251
- Benzie, I.F., & Strain, J. (1996). The ferric reducing ability of plasma (FRAP) as a measure of “antioxidant power”: The FRAP assay. Analytical Biochemistry, 239, 70–76. doi:10.1006/abio.1996.0292
- Bora, P., Holschuh, H., & da Silva, M. (2004). Characterization of plyphenol oxidase of soursop (Annona muricata L.) fruit and a comparative study of its inhibition in enzyme extract and in pulp. Cyta - Journal of Food, 4, 267–273.
- Bradford, M.M. (1976). A rapid and sensitive method for the quantitation of microgram quantities of protein utilizing the principle of protein-dye binding. Analytical Biochemistry, 72, 248–254. doi:10.1016/0003-2697(76)90527-3
- Briñez, W.J., Roig-Ságues, A.X., Hernández-Herrero, M.M., & Guamis-López, B. (2006). Inactivation of Listeria innocua in milk and orange juice by ultrahigh-pressure homogenization. Journal of Food Protection, 69, 86–92. doi:10.4315/0362-028X-69.1.86
- Chapman, J.S., Ferguson, R., Consalo, C., & Bliss, T. (2013). Bacteriostatic effect of sequential hydrodynamic and ultrasound-induced stress. Journal of Applied Microbiology, 114, 947–956. doi:10.1111/jam.12146
- Cheng, L.H., Soh, C.Y., Liew, S.C., & Teh, F.F. (2007). Effects of sonication and carbonation on guava juice quality. Food Chemistry, 104, 1396–1401. doi:10.1016/j.foodchem.2007.02.001
- Choi, M., Kim, G., & Lee, H. (2002). Effects of ascorbic acid retention on juice color and pigment stability in blood orange (Citrus sinensis) juice during refrigerated storage. Food Research International, 35, 753–759. doi:10.1016/S0963-9969(02)00071-6
- Codex Alimentarious. CAC/GL 21-1997. Principles and guidelines for the establishment and application of microbiological criteria related to foods. Rome: Food and Agriculture Organization. http://www.codexalimentarius.org/download/standards/394/CXG_021e.pdf
- Codex Alimentarius. Codex Stan 247-2005. General standard for fruit juices and nectars. Retrieved from http://www.fao.org/fao-who-codexalimentarius/shproxy/en/.pdf
- Cruz, N., Capellas, M., Hernández, M., Trujillo, A.J., Guamis, B., & Ferragut, V. (2007). Ultra-high pressure homogenization of soymilk: Microbiological, physicochemical and microstructural characteristics. Food Research International, 40, 725–732. doi:10.1016/j.foodres.2007.01.003
- Cruz, R.M.S., Vieira, M.C., Fonseca, S.C., & Silva, C.L.M. (2011). Impact of thermal blanching and thermosonication treatments on watercress (Nasturtium officinale) quality: Thermosonication process optimization and microstructure evaluation. Food and Bioprocess Technology, 4, 1197–1204. doi:10.1007/s11947-009-0220-0
- Cruz-Cansino, N.S., Ramírez-Moreno, E., León-Rivera, J.E., Delgado-Olivares, L., Alanís-García, E., Ariza-Ortega, J.A., & Jaramillo-Bustos, D.P. (2015). Shelf life, physicochemical, microbiological and antioxidant properties of purple cactus pear (Opuntia ficus indica) juice after thermoultrasound treatment. Ultrasonics Sonochemistry, 27, 277–286. doi:10.1016/j.ultsonch.2015.05.040
- Cui, H., Murthy, H.N., Moh, S.H., Cui, Y.Y., Lee, J., & Paek, K. (2014). Comparison of conventional and ultrasound-assisted methods for extraction of nutraceutical compounds from Dendrobium candidum. Cyta - Journal of Food, 12, 355–359. doi:10.1080/19476337.2014.888482
- Dias, D.D.R.C., Barros, Z.M.P., Carvalho, C.B.O., Honorato, F.A., Guerra, N.B., & Azoubel, P.M. (2015). Effect of sonication on soursop juice quality. LWT - Food Science and Technology, 62, 883–889. doi:10.1016/j.lwt.2014.09.043
- Evelyn, E., & Silva, F.V. (2016). High pressure processing pretreatment enhanced the thermosonication inactivation of Alicyclobacillus acidoterrestris spores in orange juice. Food Control, 62, 365–372. doi:10.1016/j.foodcont.2015.11.007
- FDA, U.S. Food and Drug Administration. (2001c). FDA center for food safety and applied nutrition, bacteriological analytical manual (8th ed.). (Chapter 4: Enumeration of Escherichia coli and the coliform bacteria). Retrieved February 25, 2017, from https://www.fda.gov/Food/FoodScienceResearch/LaboratoryMethods/ucm064948.htm
- FDA. Food and Drug Administration. (2001a). FDA center for food safety and applied nutrition, bacteriological analytical manual (8th ed.). (Chapter 3: Aerobic plate count). Retrieved February 25, 2017, from https://www.fda.gov/Food/FoodScienceResearch/LaboratoryMethods/ucm063346.htm
- FDA. Food and Drug Administration. (2001b). FDA center for food safety and applied nutrition, bacteriological analytical manual (8th ed.). (Chapter 18: Yeasts, molds and Mycotoxins). Retrieved February 25, 2017, from https://www.fda.gov/Food/FoodScienceResearch/LaboratoryMethods/ucm071435.htm
- FDA. Food and Drug Administration. (2004). Guidance for Industry: Juice HACCP Hazards and Controls Guidance First Edition; Final Guidance. Retrieved from http://www.fda.gov/Food/GuidanceComplianceRegulatoryInformation/GuidanceDocuments/Juice/ucm072557.htm
- Fonteles, T.V., Costa, M.G.M., De Jesus, A.L.T., De Miranda, M.R.A., Fernandes, F.A.N., & Rodrigues, S. (2012). Power ultrasound processing of cantaloupe melon juice: Effects on quality parameters. Food Research International, 48, 41–48. doi:10.1016/j.foodres.2012.02.013
- García, D., Gómez, N., Mañas, P., Condón, S., Raso, J., & Pagán, R. (2005). Occurrence of sublethal injury after pulsed electric fields depending on the micro-organism, the treatment medium pH and the intensity of the treatment investigated. Journal of Applied Microbiology, 99(1), 94–104. doi:10.1111/jam.2005.99.issue-1
- García, D., Gómez, S., Condón, S., Raso, J., & Pagán, R. (2003). Pulsed electric fields cause sublhetal injury in Escherichia coli. Letters in Applied Microbiology, 36, 140–144. doi:10.1046/j.1472-765X.2003.01282.x
- Herceg, Z., Markov, K., Salamon, B.S., Jambrak, A.R., Vukusic, T., & Kaliterna, J. (2013). Effect of high intensity ultrasound treatment on the growth of food spoilage bacteria. Food Technology and Biotechnology, 51, 352–359.
- Imade, E.E., Ikenebomeh, M.J., Obayagbona, O.N., & Igiehon, O.N. (2013). Evaluation of changes in the microbial profile, physico-chemical and nutritional attributes during the bioconversion of soursop (Annona muricata) must to wine. Nigerian Journal of Biotechnology, 25, 1–11.
- Jabbar, S., Abid, M., Hu, B., Hashim, M.M., Lei, S., Wu, T., & Zeng, X. (2015). Exploring the potential of thermosonication in carrot juice processing. Journal of Food Science and Technology, 52, 7002–7013. doi:10.1007/s13197-015-1847-7
- Kiang, W.S., Bhat, R., Rosma, A., & Cheng, L.H. (2013). Effects of thermosonication on the fate of Escherichia coli O157: H7 and Salmonella enteritidis in mango juice. Letters in Applied Microbiology, 56, 251–257. doi:10.1111/lam.12042
- Knorr, D., Froehling, A., Jaeger, H., Reineke, K., Schlueter, O., & Schoessler, K. (2011). Emerging technologies in food processing. Annual Review of Food Science and Technology, 2, 203–235. doi:10.1146/annurev.food.102308.124129
- Maldonado, M.X., Aguilar, C., Carvajal, F., González, G., & Klotz, B. (2011). Aproximación al mecánismo de inactivación de Escherichia coli por ondas de ultrasonido de alta intensidad. Alimentos Hoy, 20, 53–68.
- Martínez-Flores, H.E., Garnica-Romo, M.G., & Bermúdez-Aguirre, D. (2015). Physico-chemical parameters, bioactive compounds and microbial quality of thermo-sonicated carrot juice during storage. Food Chemistry, 172, 650–656. doi:10.1016/j.foodchem.2014.09.072
- Meydav, S., Saguy, I., & Kopelman, I.J. (1977). Browning determination in citrus products. Journal of Agricultural and Food Chemistry, 25, 602–604. doi:10.1021/jf60211a030
- Montreau, F. (1972). Sur le dosage des composés phénoliques totaux dans les vins par la methode Folin-Ciocalteau. Connaiss Vigne Vin, 24, 397–404.
- Muñoz, A., Caminiti, I.M., Palgan, I., Pataro, G., Noci, F., Morgan, D.J., & Lyng, J.G. (2012). Effects on Escherichia coli inactivation and quality attributes in apple juice treated by combinations of pulsed light and thermosonication. Food Research International, 45, 299–305. doi:10.1016/j.foodres.2011.08.020
- Pedrero, F.D.L., & Pangborn, R.M. (1997). Evaluación sensorial de los alimentos: Métodos analíticos (pp. 103–105). México: Editorial Alhambra Mexicana.
- Pérez-González, A., Rebollar-Zepeda, A.M., León-Carmona, J.R., & Galano, A. (2012). Reactivity indexes and OH bond dissociation energies of a large series of polyphenols: Implications for their free radical scavenging activity. Journal of the Mexican Chemical Society, 56, 241–249.
- Pérez-Jiménez, J., Arranz, S., Tabernero, M., Díaz- Rubio, M.E., Serrano, J., Goñi, I., & Saura-Calixto, F. (2008). Updated methodology to determine antioxidant capacity in plant foods, oils and beverages: Extraction, measurement and expression of results. Food Research International, 41, 274–285. doi:10.1016/j.foodres.2007.12.004
- Peters, M., Badrie, N., & Comissiong, E. (2000). Processing and quality evaluation of soursop (Annona muricata L) nectar. Journal of Food Quality, 24, 361–374. doi:10.1111/j.1745-4557.2001.tb00616.x
- Prior, R.L., Wu, X., & Schaich, K. (2005). Standardized methods for the determination of antioxidant capacity and phenolics in foods and dietary supplements. Journal of Agricultural and Food Chemistry, 53, 4290–4302. doi:10.1021/jf0502698
- Rahman, M.M., Mizanur, M., & Khan, R. (2007). Analysis of Vitamin C (ascorbic acid) contents in various fruits and vegetables by UV-spectrophotometry. Bangladesh Journal of Scientific and Industrial Research, 42, 417–424.
- Rawson, A., Tiwari, B.K., Patras, A., Brunton, N., Brennan, C., Cullen, P.J., & O’Donnell, C. (2011). Effect of thermosonication on bioactive compounds in watermelon juice. Food Research International, 44, 1168–1173. doi:10.1016/j.foodres.2010.07.005
- Re, R., Pellegrini, N., Proteggente, A., Pannala, A., Yang, M., & Rice-Evans, C. (1999). Antioxidant activity applying an improved ABTS radical cation decolorization assay. Free Radical Biology and Medicine, 26, 1231–1237. doi:10.1016/S0891-5849(98)00315-3
- Scherba, G., Weigel, R.M., & Brien, W.D. (1991). Quantitative assessment of the germicidal efficacy of ultrasonic energy. Applied and Environmental Microbiology, 57, 2079–2084.
- Shaheer, C., Hafeeda, P., Kumar, R., Kathiravan, T., Kumar, D., & Nadanasabapathi, S. (2014). Effect of thermal and thermosonication on anthocyanin stability in jamun (Eugenia jambolana) fruit juice. International Food Research Journal, 21, 2189–2194.
- Sulaiman, A., Soo, M.J., Farid, M., & Silva, F.V.M. (2015). Thermosonication for polyphenoloxidase inactivation in fruits: Modeling the ultrasound and thermal kinetics in pear, apple and strawberry purees at different temperatures. Journal of Food Engineering, 165, 133–140. doi:10.1016/j.jfoodeng.2015.06.020
- Valdramidis, V.P., Cullen, P.J., Tiwari, B.K., & O’Donnell, C.P. (2010). Quantitative modelling approaches for ascorbic acid degradation and non-enzymatic browning of orange juice during ultrasound processing. Journal of Food Engineering, 96, 449–454. doi:10.1016/j.jfoodeng.2009.08.025
- Walkling-Ribeiro, M., Noci, F., Riener, J., Cronin, D.A., Lyng, J.G., & Morgan, D.J. (2009). The impact of thermosonication and pulsed electric fields on Staphylococcus aureus inactivation and selected quality parameters in orange juice. Food and Bioprocess Technology, 2, 422–430. doi:10.1007/s11947-007-0045-7
- Wordon, B.A., Mortimer, B., & Mcmaster, L.D. (2012). Comparative real-time analysis of Saccharomyces cerevisiae cell viability, injury and death induced by ultrasound (20 kHz) and heat for the application of hurdle technology. Food Research International, 47, 134–139. doi:10.1016/j.foodres.2011.04.038
- Yusaf, T. (2014). Evaluating the effect of heat transfer on cell disruption in ultrasound processes. Annals of Microbiology, 65, 1447–1457. doi:10.1007/s13213-014-0983-z