
 ?Mathematical formulae have been encoded as MathML and are displayed in this HTML version using MathJax in order to improve their display. Uncheck the box to turn MathJax off. This feature requires Javascript. Click on a formula to zoom.
ABSTRACT
Astaxanthin-loaded liposomes were prepared by employing a thin-film ultrasound method with the utilization of soy phosphatidylcholine. The preparation conditions of astaxanthin-loaded liposomes were optimized through response surface methodology. Under the optimum preparation conditions, the observed experimental results showed the vesicle size of astaxanthin-LL was 80.62 ± 4.52 nm with the polydispersity index of 0.20 ± 0.03, while the zeta potential was −31.80 ± 1.85 mV with the highest encapsulation efficiency of 97.68 ± 0.34%. The successful encapsulation of astaxanthin in liposomes was demonstrated by Fourier-transform infrared spectroscopy. Retention rate of 82.29% was obtained after 15 days of storage at 4°C in the stability study, which confirmed that the liposome membrane could retain astaxanthin effectively, especially at low storage temperature. Encapsulation could enhance significantly the antioxidant activity of astaxanthin. Additionally, the antioxidant activity of astaxanthin after encapsulation in liposomes was correlated with the incorporation efficiency of astaxanthin.
RESUMEN
En este estudio se prepararon liposomas llenos de astaxantina empleando el método de ultrasonido de capa fina y utilizando fosfatidilcolina de soya. Las condiciones de preparación de los liposomas llenos de astaxantina fueron optimizadas mediante la metodología de superficies de respuesta. Bajo estas condiciones óptimas de preparación, los resultados experimentales observados mostraron que el tamaño vesicular de la astaxantina-LL fue 80,62 ± 4,52 nm, registrando un índice de polidispersidad de 0,20 ± 0,03; además, el potencial zeta fue −31,80 ± 1,85 mV, y la mayor eficiencia de encapsulación registró un valor de 97,68 ± 0,34%. La exitosa encapsulación de la astaxantina en los liposomas se comprobó empleando la espectroscopía infrarroja transformada de Fourier. En lo que se refiere al estudio de estabilidad, al transcurrir 15 días de almacenamiento a una temperatura de 4°C se obtuvo una tasa de retención de 82,29%, lo que confirma que la membrana del liposoma puede retener eficazmente a la astaxantina, sobre todo a bajas temperaturas de almacenamiento. Por lo que, la encapsulación podría mejorar significativamente la actividad antioxidante de la astaxantina. Asimismo, se constató que después de la encapsulación en los liposomas dicha actividad se correlaciona con la eficiencia de incorporación de astaxantina.
Introduction
Astaxanthin (3,3ʹ-dihydroxy-β,βʹ-carotene-4,4ʹ-dione) is one of the keto carotenoids found in red yeast, microalga Haematococcus pluvialis and in the aquatic organisms, such as shrimp, salmon, trout and lobster (Silva et al., Citation2015). Among the carotenoids, astaxanthin is the source of pigmentation which is insoluble in water whereas soluble in most of the organic solvents.
A study has demonstrated that astaxanthin is more powerful than vitamin E and beta-carotene based on their antioxidant capacity (Naguib, Citation2000). It has been reported that in protecting the lipids from photo-oxidation by ultraviolet light, astaxanthin exhibited much stronger activity than beta-carotene and lutein (Santocono, Zurria, Berrettini, Fedeli, & Falcioni, Citation2006). Furthermore, astaxanthin as a nutraceutical has some vital functions, such as alleviation of oxidative stress and inflammation, enhancement of immune response, preventing cardiovascular diseases, cataract development, as well as Helicobacter pylori infection (Bustos-Garza & Barragán-Huerta, Citation2013; Higueraciapara, Félixvalenzuela, & Goycoolea, Citation2006; Park, Chyun, Kim, Line, & Chew, Citation2010). However, due to the highly unsaturated molecular structure of astaxanthin, it is very sensitive to light, oxygen, and temperature and thus prone to oxidation, isomerization, and degradation. The poor stability and water insolubility of astaxanthin greatly reduce the bioavailability and limit its applications in nutraceutical, agriculture, and medicine. Therefore, it is necessary to develop methods to broaden the range of application of astaxanthin. In this context, recently numerous methods are being dealt to improve the stability, solubility, and bioavailability of astaxanthin. Astaxanthin was incorporated into polymers (Tachaprutinun, Udomsup, Luadthong, & Wanichwecharungruang, Citation2009), embedded in a blend of egg yolk phosphatidylcholine (EYPC) and cholesterol (Peng, Chang, Peng, & Chyau, Citation2010), encapsulated by protein-based foods (Anarjan & Tan, Citation2013), embedded in hydroxypropyl-β-cyclodextrin (Yuan, Du, Jin, & Xu, Citation2013), encapsulated into a mixture of protein and carbohydrate (Shen & Quek, Citation2014), and embedded in DNA/chitosan (Wang et al., Citation2017).
From the above, it is obvious that encapsulation is effective in providing a physicochemical carrier to protect the sensitive compounds in the core, to enhance solubility, to control the release of core material, as well as to extend the shelf-life of the formed product. Among the delivery systems, liposomes are one of the most potential carriers, owing to their targeting ability, biological compatibility, controlled release property, and capacity to deliver both lipophilic and hydrophilic substances. Liposomes are self-assembled spherical vesicles of bilayer membrane, the structure of which is similar to cellular membrane. Liposomes are formed by one or more bilayers of phospholipid. The different types of the phospholipids affect the type of liposomes formed, their stability, charge, encapsulation efficiency (EE), leakage, and also in their release. Depending on the source, phospholipids are classified into natural and synthetic phospholipids which also differ in their chemical structure. Natural phospholipids have been widely applied in the preparation of liposomes, due to their abundant availability and low cost than the synthetic phospholipids. The main sources of natural phospholipids are vegetable oils (soy, cottonseed, maize, and rape seed) and tessuti animali (egg yolk and beef brain). Utilization of soy phosphatidylcholine (SPC) for the biological properties has more advantages as compared to making use of other natural phospholipids such as EYPC or milk phospholipids. The existence of larger amounts of polyunsaturated fatty acids in SPC makes it potentially useful in reducing the risk of coronary heart disease (Singh, Gangadharappa, & Mruthunjaya, Citation2017). It has also been reported that SPC plays a salutary role, which may help remove cholesterol from circulation, increase the levels of circulating high density lipoprotein in plasma, and prevent liver from damage by alcohol, drugs, and other toxins (Gundermann, Kuenker, Kuntz, & Droÿdziket, Citation2011). To the best of our knowledge, there have been only fewer reports which deal with encapsulation of astaxanthin using SPC as a wall material. Thus in this study, SPC due to its abundant, functional, and low-cost food ingredient nature, it was adopted to generate astaxanthin-loaded liposomes (astaxanthin-LL). Additionally, previous studies have reported that the vesicle size of liposomes encapsulating astaxanthin was larger in the range from 237 ± 45 to 251 ± 23 nm (Peng et al., Citation2010). The application of ultrasound effectively decreases the vesicle size and thus it could be applied to prepare nanoliposomes. In general, to achieve the nanoscale, in this work, thin-film combined with ultrasound method was utilized to encapsulate astaxanthin.
Based on the above, the aim of this study was to prepare astaxanthin-LL by thin-film ultrasound method, employing SPC. The optimum formulation represents a critical step while the substrate and encapsulation method have been ascertained. Using EE as a main value index, response surface methodology (RSM) was used to optimize the preparation conditions of astaxanthin-LL. The detailed characterization of astaxanthin-LL was investigated including the vesicle size, size distribution, zeta potential, and morphology. Fourier-transform infrared (FTIR) spectroscopy was further utilized to check whether astaxanthin was successfully embedded in liposomes by evaluating the variations on the position, intensity, and shape of the characteristic absorption peaks. To investigate the shelf-life of astaxanthin-LL, its storage stability was measured during the storage period of 15 days. Furthermore, the antioxidant activity of astaxanthin was also carried out.
Materials and methods
Materials
SPC with 98% purity was purchased from Shenyang Tian feng Bio-pharmaceuticals Co., Ltd (Liaoning, China). Astaxanthin (98% purity) was obtained from Sigma (Germany). Cholesterol (95% purity) and 2,2-diphenyl-1-picrylhydrazyl (DPPH; 98% purity) were purchased from Aladdin (Shanghai, China). All other reagents employed were of analytical grade, and deionized water was utilized in all experiments.
Preparation of astaxanthin-loaded liposomes by thin-film ultrasound method
Astaxanthin-LL was prepared by the thin-film ultrasound method. Briefly, astaxanthin was dissolved in chloroform together with 200 mg of SPC and 50 mg of cholesterol. This resulted in the formation of a thin film, from which chloroform was removed through a rotary evaporator at 50°C. The thin film was then hydrated with 0.05 M phosphate-buffered solution (PBS) by vortexing for 30 min at 50°C. To obtain the nanoscale, ultrasonic probe was used in an ice bath for 4 min with 5 s pulse-on and 5 s pulse-off (100 W, 20 kHz; maximum rating power, 500 W; Ningbo Scientz Biotechnology Co., Ltd.). The generated liposome samples were then transferred to brown glass vials filled with nitrogen and stored at 4°C in environment protected from the light.
Response surface methodology experimental design
Based on the results of single-factor experiments, four significant parameters were confirmed as follows: pH of PBS (A), ratio of SPC to cholesterol (w/w) (B), ratio of organic phase to water phase (v/v) (C), and ultrasound time (min) (D). EE is one of the most significant assessment indexes for liposomes. RSM was used to evaluate the influences of selected parameters on the response (EE) with a four-factor–three-coded level Box–Behnken design (BBD). The range and the levels of experiment variable investigated are presented in . The optimum preparation conditions and the relationships of the variables were obtained through Design Expert 8.0.6.1 (Stat-Ease Inc., Minneapolis, MN, USA).
Table 1. Coded and levels of the variables used in Box–Behnken design.
Tabla 1. Codificación y niveles de las variables utilizadas en el diseño Box-Behnken.
Characterization and morphology of astaxanthin-loaded liposomes
Physicochemical characterization of astaxanthin-LL, including EE, size distribution, and zeta potential, was measured as follows. The morphology of astaxanthin-LL was visualized using atomic force microscopy (AFM) and transmission electron microscopy (TEM) analysis.
Determination of encapsulation efficiency and retention rate
The maximum absorbance of astaxanthin was observed at 492 nm using the UV–visible spectrophotometer (TU-1810; Persee Co., Ltd, Beijing, China). Astaxanthin sample was dissolved in chloroform to generate the standard solutions of different concentrations and the absorbance of the standard solutions was measured at 492 nm, where chloroform was used as the blank. From this, the standard calibration curve (Y = 0.1419 × X + 0.0017 with r2 = 0.9998) of astaxanthin was obtained.
In the above expression, Y is the absorbance at 492 nm and X is the concentration of astaxanthin (μg/mL). The concentration of astaxanthin was measured through centrifugal extraction and chemical colorimetric technique based on the following method: 400 μL of astaxanthin-LL and 5 mL of petroleum ether were mixed by stirring slightly for 5 min at 30°C. The mixture was centrifuged at 3000 rpm for 5 min to collect the supernatant. The same procedure was repeated two times. Then, all collected supernatant was deposited to a round-bottom flask and then attached to a rotary evaporator to remove the petroleum ether at 50°C. Finally, the residue obtained after evaporation was dissolved in chloroform. The concentration of free astaxanthin was determined at 492 nm using UV–visible spectrophotometer and employing chloroform as blank. Each measurement was performed in triplicates. The EE (%) and retention rate (RR, %) were quantified by the following equations:
Determination of size distribution and zeta potential
Size distribution and zeta potential of astaxanthin-LL were evaluated at 25°C through dynamic light scattering (DLS) (Nano-ZS90, Malvern Instruments Ltd., UK), where the detector angle was at 90°. The samples were diluted by 200-folds with deionized water. The obtained results are the average of at least three measurements.
Morphological study using atomic force microscopy
The morphology of astaxanthin-LL was visualized using AFM (Dimension icon; NT-MDT Co., Russia). The samples were diluted 1500 times by deionized water before any determination. One drop of the diluted sample was placed onto clean monocrystalline silicon piece and was then dried in a dryer.
Morphological study using transmission electron microscopy
The morphology of astaxanthin-LL was also performed by a TEM (HT7700, Hitachi, Japan). About 1 μL of sample after diluting three times by the same PBS was placed onto copper grid with the support film and kept for 5 min. The copper net was then stained by phosphotungstic acid (2%) for 5 min. The excess solution was then removed using a filter paper. After dust-free drying for at least 2 h at room temperature, the copper grid was then observed through TEM.
Fourier-transform infrared spectroscopy analysis
All the samples were lyophilized for at least 24 h using a freeze-drier (BenchTop Pro, Virtis, USA) before the measurements. Lyophilized samples (1 mg) and pre-dried KBr (100 mg, chromatographic grade) were ground into uniform powder and pressed into a disk with appropriate thickness. The samples were then subjected to measurement using a FTIR spectrometer (WQF-510A; Beifen-Ruili Analytical Instrument (Group) Co., Ltd., China) in the range of 400–4000 cm−1 at room temperature. Pure KBr disk was used to measure the background. The IR spectra of astaxanthin-LL were compared with astaxanthin, SPC, as well as the physical mixture including SPC and astaxanthin.
Storage stability of astaxanthin-loaded liposomes
The astaxanthin-LL was transferred into brown glass volumetric flask immediately after the preparation. It was then flushed with nitrogen and stored at (1) 25°C in the dark and (2) 4°C in the dark. Storage stability studies were carried out by measuring the variations of RR, vesicle size, size distribution, and morphology characteristics during the storage period of 15 days.
Antioxidant activity of astaxanthin
The solutions composed of free astaxanthin solution (in ethanol) and pure liposomes were labeled as astaxanthin–liposomes mixture. This mixture was adjusted to the same concentration of astaxanthin as that of astaxanthin-LL. The concentrations of astaxanthin (mastaxanthin/mSPC, % w/w) were selected at 0.5%, 1.0%, 1.5%, 2.0%, 2.5%, and 3.0%, respectively.
Reducing power
The reducing power was determined using the method by Wu et al. (Citation2017). About 1.0 mL of 1% potassium ferricyanide (K3Fe(CN)6) was added to astaxanthin-LL and astaxanthin–liposomes mixture (1.0 mL). The reactants were incubated at 50°C for 20 min and added to 1.0 mL of 10% trichloroacetic acid after cooling to room temperature. The mixed solution was centrifuged at 13,400 rpm for 10 min at 25°C. The supernatant (2.0 mL) was mixed with 2.0 mL of distilled water and 400 μL of 0.1% of FeCl3. The absorbance of the reactant solution was recorded at 700 nm by UV–visible spectrometer. The potassium ferricyanide was displaced by deionized water which was used as a blank. An increase in the absorbance was considered to determine the increase in reducing power.
DPPH radical-scavenging activity
The DPPH radical-scavenging ability of astaxanthin was carried out by the modified method as described by Sebaaly, Jraij, Fessi, Charcosset, and Greige-Gerges (Citation2015). 2.0 mL of DPPH solution (0.1 mM in ethanol) was added to 1 mL of astaxanthin-LL and astaxanthin-liposomes mixture. The mixed solution was incubated at room temperature in the dark for 30 min and then centrifuged at 3000 rpm for 10 min. The absorbance of supernatant was determined at 517 nm using UV–visible spectrometer. About 1 mL of distilled water was added to 2 mL of DPPH solution to prepare the blank samples of astaxanthin-LL and astaxanthin–liposomes mixture. Ethanol was added to prepare the control solution instead of DPPH solution which is in the same way as that of the above method. The percentage of DPPH scavenging effect was evaluated by the following equation:
where A517nm sample is the absorbance of sample, A517nm control is the absorbance of the control, and A517nm blank is the absorbance of the blank.
Lipid peroxidation inhibition capacity
The lipid peroxidation inhibition capacity was measured using thiobarbituric acid reactive substance (TBARS), which was carried out based on the reported method but with some modifications (Tan et al., Citation2013). About 0.375 g of thiobarbituric acid (TBA) and 15 g of trichloroacetic acid (TCA) were mixed with 100 mL of hydrochloric acid (250 mM) (HCl), which was labeled as TCA–TBA–HCl. About 5.0 mL of TCA–TBA–HCl was added to astaxanthin-LL and astaxanthin–liposomes mixture (1.0 mL). The mixtures were then heated in a water bath for 30 min which generated a pink solution due to the reaction with malondialdehyde [(MDA)2-TBA]. The obtained pink solution was then centrifuged at 3000 rpm for 10 min after cooling down rapidly with the running water. The absorbance of the supernatant was measured using UV–visible spectrometer at 532 nm (A532nm). The blank liposome represents the liposome without astaxanthin. Ac is the absorbance at 532 nm of the blank liposome, and As is the absorbance at 532 nm of astaxanthin-LL or astaxanthin–liposomes mixture. The inhibition percentage (%) was obtained from the following equation:
Statistical analysis
All the experiments were performed at least in triplicates. The obtained values have been represented as mean ± standard deviation. A one-way analysis of variance (ANOVA) test was subjected to the analysis using SPSS software version 23.0 (SPSS Inc., Chicago, IL, USA). Based on the Duncan’s multiple comparison test, the differences among the values were determined.
Results and discussion
Preparation of astaxanthin-loaded liposomes
There were 29 experimental runs for optimizing the four parameters through BBD. The design of experiment and results are listed in , which showed that the EE ranged from 75.90% to 98.63%. Based on the evaluation of data, the second-order polynomial equations were gained as follows:
Table 2. The experimental design and response results.
Tabla 2. Diseño experimental y resultados de respuesta.
Final equation in terms of coded factors:
Final equation in terms of actual factors:
The statistical significance of the quadratic model was checked by F-test and p-value. ANOVA test was observed in . The p-value of <0.05 implied the significance of the model term. The p-value of the lack of fit was 0.1284, which indicated that the model equation was adequate. The determination coefficient (R2 = 0.9756) suggested that the experimental results adequately fitted the selected equation.
Table 3. Statistical analysis of variance for the experimental results.
Tabla 3. Análisis estadístico de la varianza para los resultados experimentales.
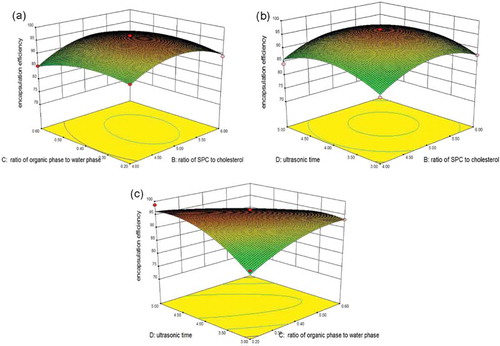
The interaction of four independent variables (A–D) on EE was illustrated by three-dimensional representation of the response surfaces as shown in and . Based on the calculation of RSM mode, the optimum preparation conditions were obtained as follows: pH of PBS = 7.4, ratio of SPC to cholesterol = 5:1, ratio of organic phase to water phase = 0.2, and ultrasonic time = 4 min. Under these conditions, the predictive EE was 97.30 ± 0.58%. Moreover, confirmation experiment was performed using the optimum preparation conditions. The mean value of practical EE was 97.68 ± 0.34% (n = 3), which is fairly close to the predictive EE.
Figure 1. Response surface model plot showing the effects of ratio of SPC to cholesterol and pH (a), ratio of organic phase to water phase and pH (b), ultrasonic time and pH (c) on encapsulation efficiency.
Figura 1. Diagrama del modelo de superficies de respuesta indicando los efectos de la ratio de SPC a colesterol y pH (a), la ratio de la fase orgánica a la fase acuosa y pH (b), el tiempo ultrasónico y pH (c), en la eficiencia de encapsulación.
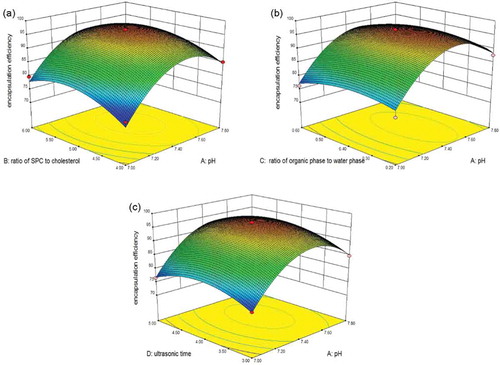
Figure 2. Response surface model plot showing the effects of ratio of organic phase to water phase and ratio of SPC to cholesterol, (a)ultrasonic time and ratio of SPC to cholesterol (b), ultrasonic time and ratio of organic phase to water phase (c) on encapsulation efficiency.
Figura 2. Diagrama del modelo de superficies de respuesta indicando los efectos de la ratio de la fase orgánica a la fase acuosa y la ratio de SPC a colesterol (a), el tiempo ultrasónico y la ratio de SPC a colesterol (b), el tiempo ultrasónico y la ratio de la fase orgánica a la fase acuosa (c) en la eficiencia de encapsulación.
Characterization of astaxanthin-loaded liposomes
The EE is considered to be the major factor of influence in case of applications where liposomes are applied as carriers. The EE of astaxanthin-LL under the optimum preparation conditions was 97.68 ± 0.34%, which is higher than the value reported from previous papers (Machado et al., Citation2014; Taksima, Limpawattana, & Klaypradit, Citation2015). Machado et al. (Citation2014) reported that the maximum EE of 48.25% was obtained for the encapsulation of astaxanthin, whereas the highest EE of 91.34% was reported by Taksima et al. (Citation2015) with astaxanthin encapsulated by beads.
In the present case, the astaxanthin-LL exhibited smaller mean diameter (80.62 ± 4.52 nm), which is much less than that of the mean diameters reported by Tamjidi, Shahedi, Varshosaz, and Nasirpour (Citation2014) for astaxanthin-loaded nanostructured lipid carriers which were in the range from 85.1 to 138.3 nm. The polydispersity index (PDI) is a measure of the size distribution of liposome samples which ranges from 0 to 1.0. The PDI value of <0.25 expresses a narrower size distribution, but the PDI value of >0.5 exhibits a wider size distribution and indicates that the sample contains larger vesicles and aggregates (Lakshmi & Kumar, Citation2010). The astaxanthin-LL under the optimum formulation had a narrow PDI (0.20 ± 0.03), which is in accordance with the results as shown in . It could be noted that the distribution of astaxanthin-LL is uniform, which may be due to a strong mechanical force on liposomes through ultrasound treatment, thereby greatly decreasing the size of liposomal vesicles and enhancing the vesicles to be in uniform size distribution.
Figure 3. Size distribution of prepared astaxanthin-loaded liposomes. The study was performed immediately after the preparation.
Figura 3. Distribución por tamaños de los liposomas llenos de astaxantina preparados. El estudio se realizó inmediatamente después de la preparación.
Another important index, zeta potential, has a vital influence on the stability of the liposomes. The greater the absolute value of zeta potential, the higher the surface charge on the liposomal carriers, which can result in increasing the magnitude of repulsive forces among the vesicles to protect the liposomal carriers from aggregations (Yousefi, Esmaeili, Rahimian, & Dinarvand, Citation2009). The absolute value of zeta potential (>30 mV) is considered stable and beneficial for long-term storage (Hunter, Midmore, & Zhang, Citation2001). In this study, the astaxanthin-LL was prepared by the lipids consisting of cholesterol and phospholipids. The head group of phospholipids manipulates the surface charge of vesicles (Zhao, Temelli, Curtis, & Chen, Citation2015). The zeta potential of astaxanthin-LL prepared was −31.80 ± 1.85 mV (pH 7.4), which exhibited sufficient charge to inhibit aggregations of vesicles. The larger zeta potential of astaxanthin-LL was attributed to the interaction between astaxanthin and SPC. The hydroxyl group of astaxanthin could interact with choline in the polar head group of SPC to generate the dipole tropism, which increased the surface charge of vesicles (Fan, Xu, Xia, & Zhang, Citation2008).
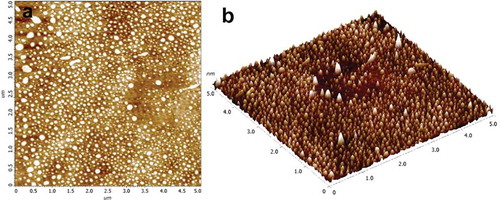
The morphological characterization of astaxanthin-LL was observed by AFM analysis (). Most of the astaxanthin-LL vesicles were mainly consisting of globules with a relatively monodispersed size distribution, and mostly with the diameter of <100 nm. The above result is consistent with that measured by DLS. As shown in the AFM image, several larger liposomes could be noted, which may be due to the aggregations of some smaller vesicles. Overall, through the above characterization studies, the superiority of astaxanthin-LL liposomes could be noted as compared to the previous studies in terms of higher EE, smaller vesicle size with a relatively narrow size distribution, and higher absolute value of zeta potential.
Figure 4. Atomic force micrograph (a) and three-dimensional image (b) of astaxanthin-loaded liposomes.
Figura 4. Micrógrafo de fuerza atómica (a) e imagen tridimensional (b) de liposomas llenos de astaxantina.
Fourier-transform infrared spectroscopy analysis
To further demonstrate the successful formation of astaxanthin-LL, the formed samples were subjected to FTIR. exhibits the FTIR spectra of astaxanthin, astaxanthin-LL, SPC, as well as the physical mixture including astaxanthin and SPC. The FTIR spectrum of astaxanthin revealed the characteristic absorption bands at 1654 cm−1 for C=O stretching vibration, 1552 cm−1 for C=C stretching vibration in the aromatic ring, 1367 cm−1 for symmetric deformation of CH deformation in plane, 975 cm−1 for C–H stretching vibration in C–C conjugate system, as well as 1280 and 1074 cm−1 for C–O stretching vibrations (Zhang et al., Citation2014). Moreover, various absorption bands could be identified in the spectrum of SPC including CH2 vibration at 2925 and 2854 cm−1, CC=O symmetrical stretching vibration at 1739 cm−1, PO2− symmetric stretching band at 1091 cm−1, and asymmetric stretching of N+ (CH3)3 in SPC head groups at 975 cm−1 (Zou et al., Citation2014). Both astaxanthin-LL and the physical mixture showed peaks at 1654 cm−1 (C=O stretching vibration), which were the characteristic peak of astaxanthin. On the other hand, the FTIR spectrum of the physical mixture was similar to that of SPC. Different from this, both the absorption bands of astaxanthin-LL at 1091 and 975 cm−1 became wider than SPC and shifted to lower wavenumbers. However, it is obvious that the FTIR spectrum of the physical mixture exhibited an approximate superimposition of SPC and astaxanthin. All these results clearly confirmed that there could be interaction between astaxanthin and lipid bilayer, which resulted in the formation of astaxanthin-LL.
Figure 5. Fourier-transform infrared spectroscopy of astaxanthin (a), astaxanthin-loaded liposomes (b), SPC (c), and physical mixture of astaxanthin and SPC (d).
Figura 5. Espectroscopía infrarroja transformada de Fourier de astaxantina (a) liposomas llenos de astaxantina (b), SPC (c) y la mezcla física de astaxantina y SPC (d).
Storage stability of astaxanthin-loaded liposomes
It could be observed from that after 15 days, the RR under the storage temperatures of 4°C and 25°C decreased to 82.29% and 61.32%, respectively. The observed differences in RR at the storage temperatures of 4°C and 25°C were significant (p < 0.05). These experimental results implied that the capacity of liposome membrane retaining the astaxanthin at 4°C was higher than at 25°C. Yin and Faustman (Citation1993) reported that the hydrolysis and oxidation of phospholipids altered the bilayer structure of liposomes. In general, the hydrolysis rate of phospholipid increases with an increase in the storage temperature, which results in an increase in the leakage of encapsulated astaxanthin. As shown in , only a slight increase in the PDI could be noted at 4°C, whereas the PDI sharply increased to 0.85 at 25°C after 15 days of storage. It implied more uniform size distribution of astaxanthin-LL during the storage period at 4°C than at 25°C, which was also confirmed by the TEM micrograph as shown in .
Figure 6. Change in retention rate (RR) (a) and polydispersity index (PDI) (b) of astaxanthin-loaded liposomes over time under different storage conditions. Data are represented as the mean ± standard deviation (n = 3).
Figura 6. Cambios ocurridos en el tiempo en la tasa de retención (RR) (a) y el índice de polidispersidad (PDI) (b) de liposomas llenos de astaxantina, bajo distintas condiciones de almacenamiento. Los datos figuran como medias ± desviación estándar (n = 3).
Figure 7. Transmission electron micrographs of astaxanthin-loaded liposomes after 0 day of storage (a) and after 15 days of storage at 4°C (b) and at 25°C (c, d). (a)–(c) Magnified 70,000× and (d) magnified 40,000×.
Figura 7. Micrografía electrónica de transmisión de liposomas llenos de astaxantina después de 0 días de almacenamiento (a), después de 15 días de almacenamiento a 4°C (b) y a 25°C (c, d). (a)–(c) fueron ampliados 70.000×, y (d) se amplió 40.000×.
From , even distribution of liposomes could be observed where the mean diameter was in the range from 50 to 80 nm at 0 day, which agrees well with the results (78.61 ± 4.13 nm) as determined by DLS (). The mean diameters and morphological characteristics of astaxanthin-LL were determined during the storage period of 15 days. As could be seen from , the mean diameters of astaxanthin-LL stored at different temperatures increased with an increase in time. After 15 days, the astaxanthin-LL vesicles stored at 4°C were still, in general, well dispersed and spherical, and the mean diameter increased to about 130 nm ( and ). On the other hand, the same trend of an increase in the mean diameter for astaxanthin-LL stored at 25°C was observed. It may also be witnessed that the astaxanthin-LL vesicles stored at 25°C were mainly spherical and the mean diameter increased to about 200 nm after 15 days (), which is significantly less than the result (3917.55 ± 11.73 nm) as measured by DLS (). The considerably different results as noted in this case may be due to the aggregations of astaxanthin-LL during storage at 25°C, which could result in the measurement error by DLS. The TEM micrograph as shown in also supports this conclusion. It was revealed that the higher storage temperature can induce the aggregations of astaxanthin-LL. Meanwhile, these experimental results implied that astaxanthin-LL had a slow increase in the mean diameter irrespective of the storage temperatures of 4°C or 25°C.
Table 4. The mean diameter of astaxanthin-loaded liposomes over time under different storage conditions.
Tabla 4. Diámetro promedio de los liposomas llenos de astaxantina con el transcurso del tiempo bajo distintas condiciones de almacenamiento.
Compared to RR, the size distribution, vesicle size, and morphological characteristics of liposomes stored at 4°C and 25°C, the mean diameter and PDI of astaxanthin-LL stored at 4°C maintained a relatively stable value and the leakage rate of astaxanthin was much less than at 25°C. Based on the experimental results, it indicates that the storage temperature plays a critical role on the physical stability of astaxanthin-LL. It may be attributed to the liposomes stored at lower temperature retarding the oxidative degradation of unsaturated fatty acids in the phospholipid bilayer, causing low permeability of coating layers, as well as inhibition of aggregations (low molecular mobility) (Gibis, Zeeb, & Weiss, Citation2014; Zhao et al., Citation2011).
Antioxidant activity of astaxanthin
Reducing power
When there are reductants, Fe3+ could be reduced to Fe2+. Determination of the generation of Perl’s Prussian blue at 700 nm was performed to assess the amount of Fe2+. It could be noted from that the reducing power of each sample increased with the addition of astaxanthin. The explanation was that the conjugated double bond in the molecular structure of astaxanthin can provide electrons as reductant to reduce Fe3+ to Fe2+, which resulted in an enhancement in the reducing power. Reducing power was affected not only by the conjugated double bond, but also by the steric hindrance of molecules. The reducing power of astaxanthin after encapsulation in liposomes increased by 0.8 (A700nm) when the concentration of astaxanthin increased from 0.0% to 3.0%, whereas the reducing power of free astaxanthin directly mixed with pure liposomes only by 0.05 (A700nm). Obviously, astaxanthin after encapsulation in liposomes has much stronger reducing power as compared to that directly mixed with liposomes. This result may be attributed to the reduced steric hindrance of molecules when astaxanthin was embedded into the liposome membrane, resulting in an increase in reducing power.
Figure 8. Reducing power (a), DPPH radical-scavenging activity (b), and lipid peroxidation inhibition capacity (c) of astaxanthin when encapsulated in liposomes or directly mixed with liposomes. Data are represented as the mean ± standard deviation (n = 3).
Figura 8. Poder reductor (a), actividad de eliminación de radicales DPPH (b) y capacidad de inhibición de la perioxidación lipídica (c) de astaxantina tras ser encapsulada en liposomas o mezclada directamente con liposomas. Los datos figuran como medias ± desviación estándar (n = 3).
DPPH radical-scavenging activity
DPPH is a stable free radical, which can directly react with hydrogen provided by the antioxidants to generate a stable DPPH-H. A decrease in the absorbance at 517 nm has been considered to measure the DPPH radical-scavenging capacity of astaxanthin, which follows a change in the color of DPPH from purple to yellow. The scavenging ability of DPPH was applied as the evaluation index of antioxidant capacity of the samples. As shown in , the addition of astaxanthin enhanced the capacity in scavenging the DPPH radicals to a certain range before and after encapsulation in liposomes. Owing to the presence of 11 conjugated double bonds and two β-ionone rings in the astaxanthin, it has strong DPPH scavenging ability. When encapsulated in liposomes, astaxanthin displayed much higher DPPH scavenging activity as compared to that directly mixed with pure liposomes regardless of the concentration of astaxanthin. This could be attributed to the encapsulation which might improve the water solubility and dispersibility of astaxanthin. Furthermore, it was observed that the scavenging ability of each sample was reflected by the concentration of astaxanthin. The changes as noted in the trend for DPPH scavenging activity of astaxanthin after encapsulation in liposomes were similar to astaxanthin when it was directly mixed with liposomes. With an increase in the concentration of astaxanthin from 0.0% to 1.0%, the ability of scavenging the DPPH radicals of each sample enhanced. When encapsulated in liposomes, astaxanthin exhibited the highest percentage of DPPH scavenging ability (75.10%) with an increase in the concentration of astaxanthin up to 1.0%. However, the radical-scavenging ability of each sample decreased significantly within the concentration range of astaxanthin, i.e. 1.0−2.0% (p < 0.05). When the concentration of astaxanthin was >2.0%, the ability of scavenging the DPPH radicals of each sample was stabilized. This may be due to the consequences of low solubility and extent of aggregations of astaxanthin at their high concentration, causing a decrease in their radical-scavenging activity. It is worth mentioning that the trend observed from the current study matches with the previous studies, i.e. the incorporation efficiency of astaxanthin reduced with an increase in the concentration of astaxanthin. Thus, for astaxanthin-LL, the change in the ability of scavenging the DPPH radicals of astaxanthin was probably due to the small amount of astaxanthin embedded into the liposome membrane with an increase in the concentration of astaxanthin.
Lipid peroxidation inhibition capacity
SPC is comprised of polyunsaturated fatty acids chains which are liable to oxidization, and thus can induce the high membrane permeability of liposomes. Hence, the protection from lipid peroxidation is a critical step to retain the encapsulated astaxanthin. The product of peroxidation can be determined as TBARS. As could be seen from , the inhibition percentage of astaxanthin after encapsulation in liposomes was higher than pure astaxanthin directly mixed with liposomes regardless of the concentration of astaxanthin. It was observed that the inhibition percentage of each sample exhibited an increase with increasing the concentration of astaxanthin up to 2.5%. This may be due to the structural features of astaxanthin which contains polyene hydrocarbon and phenol oxygen radicals to quench the singlet oxygen and to protect the unsaturated lipid from singlet oxygen injury to finally prevent the lipid peroxidation. Furthermore, the inhibition percentage of each sample stabilized and displayed a slight reduction beyond the concentration of astaxanthin, i.e. 3.0%. This is consistent with the results reported by Tan et al. (Citation2014). For the mixture of astaxanthin solution and liposomes, the observed trend may be due to the aggregations or crystals of astaxanthin at its higher concentration. However, for the astaxanthin encapsulated in liposomes, its higher concentration can lead to low incorporation efficiency based on the previous study, which is similar to DPPH radical-scavenging activity. It indicates that there is a relationship between inhibition percentage and the efficiency of astaxanthin incorporated into the liposome membrane. Due to the inhibition of lipid peroxidation of astaxanthin, it can result in the integrity of lipid structure and high incorporation efficiency of astaxanthin. Also, the lipid peroxidation can destroy the liposome membrane and impair the protection effect of core material. Thus, it was revealed that there could be a coordinated protection between astaxanthin and liposome membrane.
Conclusions
The current investigation work clearly demonstrated that astaxanthin-LL could be prepared by the thin-film ultrasound method and by employing SPC. The optimum conditions for preparing astaxanthin-LL were obtained as follows: pH of PBS = 7.4, ratio of SPC to cholesterol = 5:1, ratio of organic phase to water phase = 0.2, ultrasonic time = 4 min. Under these conditions, the astaxanthin-LL exhibited superiority in terms of its higher EE, smaller vesicle size with a relatively narrow size distribution, and higher absolute value of zeta potential for the liposomes as compared to the previous studies. FTIR spectrum suggested that there could be interactions between astaxanthin and lipid bilayer which led to the formation of astaxanthin-LL. Based on the experimental results of storage stability, it has been demonstrated that the liposomal membrane could retain astaxanthin effectively. Especially, astaxanthin-LL at low storage temperature could strongly inhibit the leakage and aggregations. Based on the measurements of antioxidant activity, including reducing power, DPPH radical-scavenging activity, and lipid peroxidation inhibition capacity, it could be concluded that the encapsulation enhanced the antioxidant activity of astaxanthin. Moreover, the antioxidant activity of astaxanthin after encapsulation in liposomes had relation not only to its chemical reactivity, but also to its incorporation efficiency into the liposome membrane. These results may provide useful information on the development of liposomes for an efficient delivery of hydrophobic compounds in nutraceutical and functional foods.
Disclosure statement
No potential conflict of interest was reported by the authors.
Additional information
Funding
References
- Anarjan, N., & Tan, C. P. (2013). Chemical stability of astaxanthin nanodispersions in orange juice and skimmed milk as model food systems. Food Chemistry, 139(1–4), 527–531. doi:10.1016/j.foodchem.2013.01.012
- Bustos-Garza, C., & Barragán-Huerta, B. E. (2013). Thermal and pH stability of spray-dried encapsulated astaxanthin oleoresin from Haematococcus pluvialis using several encapsulation wall materials. Food Research International, 54(1), 641–649. doi:10.1016/j.foodres.2013.07.061
- Fan, M., Xu, S., Xia, S., & Zhang, X. (2008). Preparation of salidroside nano-liposomes by ethanol injection method and in vitro release study. European Food Research & Technology, 227(1), 167–174. doi:10.1007/s00217-007-0706-9
- Gibis, M., Zeeb, B., & Weiss, J. (2014). Formation, characterization, and stability of encapsulated hibiscus extract in multilayered liposomes. Food Hydrocolloids, 38(4), 28–39. doi:10.1016/j.foodhyd.2013.11.014
- Gundermann, K. J., Kuenker, A., Kuntz, E., & Droÿdziket, M. (2011). Activity of essential phospholipids (EPL) from soybean in liver diseases. Pharmacological Reports, 63(3), 643–659. doi:10.1016/S1734-1140(11)70576-X
- Higueraciapara, I., Félixvalenzuela, L., & Goycoolea, F. M. (2006). Astaxanthin: A review of its chemistry and applications. Food Science & Nutrition, 46(2), 185–196.
- Hunter, R. J., Midmore, B. R., & Zhang, H. (2001). Zeta potential of highly charged thin double-layer systems. Journal of Colloid & Interface Science, 237(1), 147–149. doi:10.1006/jcis.2001.7423
- Lakshmi, P., & Kumar, G. A. (2010). Nano-suspension technology: A review. International Journal of Pharmacy & Pharmaceutical Sciences, 2(4), 35–40.
- Machado, F. R. S., Jr., Reis, D. F., Boschetto, D. L., Burkert, J. F. M., Ferreira, S. R. S., Oliveira, J. V., & Burkert, C. A. V. (2014). Encapsulation of astaxanthin from Haematococcus pluvialis, in PHBV by means of SEDS technique using supercritical CO2. Industrial Crops & Products, 54(2), 17–21. doi:10.1016/j.indcrop.2014.01.007
- Naguib, Y. M. (2000). Antioxidant activities of astaxanthin and related carotenoids. Journal of Agricultural & Food Chemistry, 48(4), 1150–1154. doi:10.1021/jf991106k
- Park, J. S., Chyun, J. H., Kim, Y. K., Line, L. L., & Chew, B. P. (2010). Astaxanthin decreased oxidative stress and inflammation and enhanced immune response in humans. Nutrition & Metabolism, 7(1), 18. doi:10.1186/1743-7075-7-18
- Peng, C. H., Chang, C. H., Peng, R. Y., & Chyau, C. C. (2010). Improved membrane transport of astaxanthine by liposomal encapsulation. European Journal of Pharmaceutics & Biopharmaceutics, 75(2), 154–161. doi:10.1016/j.ejpb.2010.03.004
- Santocono, M., Zurria, M., Berrettini, M., Fedeli, D., & Falcioni, G. (2006). Influence of astaxanthin, zeaxanthin and lutein on DNA damage and repair in UVA-irradiated cells. Journal of Photochemistry & Photobiology B Biology, 85(3), 205–215. doi:10.1016/j.jphotobiol.2006.07.009
- Sebaaly, C., Jraij, A., Fessi, H., Charcosset, C., & Greige-Gerges, H. (2015). Preparation and characterization of clove essential oil-loaded liposomes. Food Chemistry, 178(03), 52–62. doi:10.1016/j.foodchem.2015.01.067
- Shen, Q., & Quek, S. Y. (2014). Microencapsulation of astaxanthin with blends of milk protein and fiber by spray drying. Journal of Food Engineering, 123(2), 165–171. doi:10.1016/j.jfoodeng.2013.09.002
- Silva, F. O. D., Tramonte, V. L. C. G., Parisenti, J., Lima-Garcia, J. F., Maraschin, M., & Silva, E. L. D. (2015). Litopenaeus vannamei, muscle carotenoids versus, astaxanthin: A comparison of antioxidant activity and in vitro, protective effects against lipid peroxidation. Food Bioscience, 9, 12–19. doi:10.1016/j.fbio.2014.11.001
- Singh, R. P., Gangadharappa, H. V., & Mruthunjaya, K. (2017). Phospholipids: unique carriers for drug delivery systems. Journal of Drug Delivery Science & Technology, 39, 166–179. doi:10.1016/j.jddst.2017.03.027
- Tachaprutinun, A., Udomsup, T., Luadthong, C., & Wanichwecharungruang, S. (2009). Preventing the thermal degradation of astaxanthin through nanoencapsulation. International Journal of Pharmaceutics, 374(1–2), 119–124. doi:10.1016/j.ijpharm.2009.03.001
- Taksima, T., Limpawattana, M., & Klaypradit, W. (2015). Astaxanthin encapsulated in beads using ultrasonic atomizer andapplication in yogurt as evaluated by consumer sensory profile. LWT – Food Science and Technology, 62(1), 431–437. doi:10.1016/j.lwt.2015.01.011
- Tamjidi, F., Shahedi, M., Varshosaz, J., & Nasirpour, A. (2014). Design and characterization of astaxanthin-loaded nanostructured lipid carriers. Innovative Food Science & Emerging Technologies, 26, 366–374. doi:10.1016/j.ifset.2014.06.012
- Tan, C., Xue, J., Abbas, S., Feng, B., Zhang, X., & Xia, S. (2014). Liposome as a delivery system for carotenoids: Comparative antioxidant activity of carotenoids as measured by ferric reducing antioxidant power, DPPH assay and lipid peroxidation. Journal of Agricultural & Food Chemistry, 62(28), 6726–6735. doi:10.1021/jf405622f
- Tan, C., Xue, J., Eric, K., Feng, B., Zhang, X., & Xia, S. (2013). Dual effects of chitosan decoration on the liposomal membrane physicochemical properties as affected by chitosan concentration and molecular conformation. Journal of Agricultural & Food Chemistry, 61(28), 6901–6910. doi:10.1021/jf401556u
- Wang, Q., Zhao, Y., Guan, L., Zhang, Y., Dang, Q., Dong, P., … Liang, X. (2017). Preparation of astaxanthin-loaded DNA/chitosan nanoparticles for improved cellular uptake and antioxidation capability. Food Chemistry, 227, 9–15. doi:10.1016/j.foodchem.2017.01.081
- Wu, Y., Wang, J., Li, L., Yang, X., Wang, J., & Hu, X. (2017). Purification and identification of an antioxidant peptide from pinctada fucata muscle. CyTA – Journal of Food, 16(1), 1–9.
- Yin, M. C., & Faustman, C. (1993). Influence of temperature, pH, and phospholipid composition upon the stability of myoglobin and phospholipid: A liposome model. Journal of Agricultural & Food Chemistry, 41(6), 853–857. doi:10.1021/jf00030a002
- Yousefi, A., Esmaeili, F., Rahimian, S., & Dinarvand, R. (2009). Preparation and in vitro evaluation of a pegylated nano-liposomal formulation containing docetaxel. Scientia Pharmaceutica, 77(2), 453–464. doi:10.3797/scipharm.0806-08
- Yuan, C., Du, L., Jin, Z. Y., & Xu, X. M. (2013). Storage stability and antioxidant activity of complex of astaxanthin with hydroxypropyl-β-cyclodextrin. Carbohydrate Polymers, 91(1), 385–389. doi:10.1016/j.carbpol.2012.08.059
- Zhang, W. T., Yu, S. X., Liu, W., Zhang, D. H., Zhu, W. X., Zhang, Y. H., … Wang, J. L. (2014). “Pulling” π-conjugated polyene biomolecules into water: Enhancement of light-thermal stability and bioactivity by a facile graphene oxide-based phase-transfer approach. RSC Advances, 4(90), 48765–48769. doi:10.1039/C4RA08229J
- Zhao, L. P., Xiong, H., Peng, H. L., Wang, Q., Han, D., Bai, C. Q., … Deng, B. (2011). PEG-coated lyophilized proliposomes: Preparation, characterizations and in vitro release evaluation of vitamin E. European Food Research & Technology, 232(4), 647–654. doi:10.1007/s00217-011-1429-5
- Zhao, L. S., Temelli, F., Curtis, J. M., & Chen, L. (2015). Preparation of liposomes using supercritical carbon dioxide technology: Effects of phospholipids and sterols. Food Research International, 77, 63–72. doi:10.1016/j.foodres.2015.07.006
- Zou, L. Q., Peng, S. F., Liu, W., Gan, L., Liu, W. L., Liang, R. H., … Chen, X. (2014). Improved in vitro, digestion stability of (−)-epigallocatechin gallate through nanoliposome encapsulation. Food Research International, 64, 492–499. doi:10.1016/j.foodres.2014.07.042