
 ?Mathematical formulae have been encoded as MathML and are displayed in this HTML version using MathJax in order to improve their display. Uncheck the box to turn MathJax off. This feature requires Javascript. Click on a formula to zoom.
ABSTRACT
It is known that polyphenolic extracts have antibacterial activity, but usually with not very broad spectrum of action. To enhance its individual antibacterial effect, to combine different extracts has been proposed. In this work, the combined antibacterial effect of 3 extracts and their mixtures (Ulmo and Quillay honeys, multifloral pollen) was evaluated. Their polyphenol content was quantified by HPLC-DAD analysis. E. coli, S. aureus, Salmonella spp, Pseudomonas spp, L. acidophilus, and B. thermosphacta were used as foodborne pathogenic-spoilage strains in the antibacterial assays. Polyphenol-target bacteria relationships were established. Results showed that all extracts and their combinations have activity against all strains. Relationships were established between all pathogenic strains with 4 phenolic acids and 2 flavonoids, and 2 spoilage strains with 3 phenolic acids and 3 flavonoids. These findings will contribute to the rapid assessment of mixtures of outstandingly antibacterial extracts to be applied in the food industry.
RESUMEN
Se sabe que los extractos polifenólicos tienen actividad antibacteriana con un espectro de acción generalmente no muy amplio. Para potenciar su efecto antibacteriano individual, se ha propuesto la combinación de extractos. En este trabajo se evaluaron los efectos antibacterianos combinados en 3 extractos y sus mezclas (miel de ulmo y quillay, y polen multifloral). El contenido de polifenoles se cuantificó mediante análisis por HPLC-DAD. E. coli, S. aureus, Salmonella spp y Pseudomonas spp, L. acidophilus, B. thermosphacta se usaron como cepas patógenas de deterioro transmitidas por los alimentos en los ensayos antibacterianos. También se establecieron relaciones polifenol-bacteria. Los resultados mostraron que todos los extractos y sus combinaciones tienen actividad contra todas las cepas. Se establecieron relaciones entre todas las cepas patógenas con 4 ácidos fenólicos y 2 flavonoides, y entre 2 cepas de deterioro con 3 ácidos fenólicos y 3 flavonoides. Estos hallazgos contribuyen a la evaluación rápida de mezclas de extractos antibacterianos para usar en la industria alimentaria.
PALABRASCLAVE:
1. Introduction
Polyphenolic compounds present in an extract has different antibacterial effects. Several authors report that they interfere with metabolic enzymes, denaturate and complexate proteins, and inactivate microbial adhesins, causing leakage of cytoplasmic content of bacteria. These changes are explained by the great presence of hydroxyl groups that may form non-specific forces such as hydrogen bonding and hydrophobic forces, as well as by covalent bond formation (Chen, Zhao, Meng, & Yu, Citation2017; Kumar & Pandey, Citation2013; Salawu, Ogundare, Ola-Salawu, & Akindahunsi, Citation2011).
The use of combined polyphenolic compounds offers simultaneous inhibition of microbial growth and an increase in the spectrum of activity (Davidson & Taylor, Citation2007). Blends of polyphenolic extracts have shown synergistic, additive, and antagonistic antibacterial interactions. Synergism occurs when the total antibacterial effect is greater than the proportional addition of the antibacterial activities of the individual agents, while antagonism occurs when there is a lower effect than proportional additivity. Additivity indicates zero interaction between responsible agents.
Generally accepted mechanisms of antibacterial synergism include sequential inhibition of a common biochemical pathway, inhibition of protective enzymes, combination of active cell wall agents, and use of active cell wall agents to enhance uptake of other antimicrobials (Wagner, Citation2009). The suggested mechanisms of antagonistic antimicrobial effects are the competition of polyphenolic compounds. These compounds have the same target microorganism and chemical interactions (direct or indirect) that reduce the solubility and therefore the availability of other compounds present in the same medium (Cox, Mann, & Markham, Citation2001). Alternatively, direct interaction between two, three or more compounds may result in structural conformation changes, thus reducing antibacterial activity, in addition to inducing competition for target sites or inhibition of uptake by bacterial cells (Mandalari et al., Citation2007). Granato et al. (Citation2016), Baljeet, Simmy, Ritika, and Roshanlal (Citation2015) and Ncube, Finnie, and Van Staden (Citation2012) analyzed the effects of ethanolic and aqueous extract blends against several microorganisms. Different effects were found depending on the lipophilic properties and water solubility, combinations of extracts, bacteria strain/serotype, proportions of extracts, and type of extractant(s).
Polyphenolic rich extracts from Ulmo and Quillay honeys have shown wide antibacterial spectrum against Pseudomonas aeruginosa, Escherichia coli, Staphylococcus aureus, Streptococcus pyogenes, Streptococcus pneumoniae, and Vibrio cholerae. These properties have been related to the presence of polyphenolics such as coumaric acid, ferulic acid, salicylic acid, caffeic acid, syringic acid, vanillin acid, naringenin, rutin, and kaempferol (Montenegro et al., Citation2009; Montenegro, Santander, Jara, Nuñez, & Fredes, Citation2013). Bee pollen had shown antibacterial activity against E. coli, P. aeruginosa and S. aureus (Cabrera & Montenegro, Citation2013) related with its phenolic and flavonoid content that vary with its botanical origin (Velásquez et al., Citation2017).
Because there are no standardized methods to evaluate the activity of antimicrobial combinations, there is no clear definition of the boundaries between synergy/indifference/antagonism and many times the results are not comparable among the methods, or even the results of these are totally contradictory (Bassolé & Juliani, Citation2012; Doern, Citation2014; March & Bratos, Citation2015). The combined antimicrobial effects are usually evaluated by the checkboard and time-kill tests, but these techniques have the disadvantage that only can evaluate two compounds at the same time without consuming a lot of time and material (Doern, Citation2014; March & Bratos, Citation2015). On the same sense, the evaluation of the susceptibility of bacterial strains by disk diffusion methods is a cheap, fast and reasonably reliable alternative, and it is recognized by the Institute of Clinical and Laboratory Standards for screening of new antimicrobials (CLSI) (Balouiri, Sadiki, & Ibnsouda, Citation2016).
In this study, we investigated the bioactivities of polyphenolic extracts (Quillay and Ulmo honeys, and bee pollen) and their blends, using the mixture design methodology as an exploring test method of potentially synergistic extracts and compounds for food industry. First, we quantified polyphenolics present in individual extracts and their blends; then, we determined their bioactivity (antibacterial activity). Finally, we analysed possible relationships between the extracts and blend compositions with their bioactivities using a chemometric screening.
2. Materials and methods
2.1. Materials
Samples of Ulmo and Quillay honeys, and bee pollen, were purchased from beekeepers from Central and South area of Chile. Samples were stored at −20°C until the study (Mimet, VV-21BTF). All standard for High-resolution liquid chromatography with diode-array detector (HPLC-DAD) analysis were purchased from Sigma Aldrich Co. LLC. Amberlite XAD-2 was purchased from Supelco Bellefonte, USA.
2.2. Extracts
Samples were diluted in acidic water (pH 2 with HCl). The dissolution was put into an open chromatographic column (250 mm x 20 mm) filled with amberlite XAD-2 and washed with 250 mL of acidic water first and then with 250 mL of distilled water. These two collected residues were discarded. Finally, 200 mL of ethanol passed through the column was collected and concentrated with a vacuum rotary evaporator until dryness (Buchi, Flawil, Switzerland), filtrated (EDLAB CA 0,45 μm) and stored at −20ºC until use (Montenegro, Citation2011). Controls were carried out to ensure the innocuity of the extracts before doing the tests.
2.3. Identification and quantification of flavonoids and phenolic acids
The HPLC-DAD analysis was performed in a Merck-LaChrom HPLC Hitachi Elite equipment with a reverse phase column (LiChroCART RP-18, 5 µm x 4.6 mm x 150 mm) using two mobile phases: aqueous formic acid solution 5% v/v (A) and methanol (B) with a concentration gradient of 30–35% A (0–12 min) and 35% A (12–105 min) with a flow rate of 1 ml min-1 at 30°C). The chromatograms were monitored at 290 and 340 nm their UV spectra were recorded. The identification of phenolic components was evaluated by comparing their retention times and a spectrum obtained with available standards of phenolic acids and flavonoids.
2.4. Antimicrobial susceptibility testing by zone inhibition diameter
Bacteria strains Escherichia coli ATCC-25922, Staphylococcus aureus ATCC-25923, Pseudomonas spp. ATCC-15692, Lactobacillus acidophilus ATCC-11509, Brochothrix thermosphacta ATCC- 314 and Salmonella spp. ATCC-700623 were used. The strains were propagated on Mueller Hinton agar 24 h in advance. Then, certain colonies were selected and diluted in saline solution to ensure a concentration of 108 CFU/mL (0.5 McFarland standard; Becton-Dickinson & Company, USA). With a swab, strains were plated on petri dishes with Mueller Hinton agar, and 6 mm diameter holes were made in it and filled with 100 µL of extracts. The Petri plates were incubated for 24 hours at 35ºC. Then, the inhibition diameter that appeared around each hole was measured. Water was used as a negative control (NCCLS, Citation2002). For blends, the expected zone inhibition diameter was calculated from proportional mass balances.
2.5. Experimental design
An experimental three-component mixture design was performed using the software Statgraphics Centurion XVI (StatPoint-Technologies S.A, USA). The design included 13 runs that evaluate the individual and combined bioactivity (e.g. antibacterial) effects of 3 polyphenolic extracts (i.e. bee pollen, P; Quillay honey, Q; Ulmo honey, U) against six bacteria: E. coli ATCC-25922 (Gram -), S. aureus ATCC-25923 (Gram +), Salmonella spp. ATCC-700623 (Gram -), Pseudomonas spp. ATCC-15692 (Gram -), L. acidophilus ATCC-11509 (Gram +), and B. thermosphacta ATCC- 314 (Gram +).
The complete cubic model was applied for three () components:
Table 1. Three components mixture design showing mass proportions of binary and ternary blends in terms of individual extracts P, Q and U.
Tabla 1. Diseño de mezcla de tres componentes que muestra las proporciones en masa de las mezclas binarias y ternarias en términos de los extractos individuales P, Q y U.
where P, Q and U represent the extracts Y is the measured response (i.e. total phenolic content, total flavonoid content or antibacterial activity against each strain, βi’s are the estimated coefficients for each linear term, and δij’s are the cross product of the model. The sign and the magnitude value of the β coefficients indicate the type of effect (i.e., additive, synergistic or antagonistic). An additive effect is observed when the combined effect is equal to the sum of the individual effects. Antagonism is observed when the effect of one or both compounds is lower when applied together than when they are applied individually (negative values). Synergism is observed when the effect of the combined substances is greater than the sum of the individual effects (positive values), while the absence of interaction is defined as indifference or additive effect.
2.6. Statistical analysis and chemometrics techniques
All measurements were conducted in three independent experiments, and data were expressed as mean ± standard deviation. Significance was determined by analysis of variance, and means were evaluated through Tukey’s (LCD) procedure at p < .05. Principal component analysis (PCA) and hierarchical cluster analysis (HCA) (The Unscrambler 9.7 CAMO AS, Norway) were applied to visualize possible relationships among polyphenolics and antibacterial activity. For PCA, a matrix m x n was defined, where m corresponds to individual, binary or ternary extracts, and n, polyphenolic concentrations and antibacterial activity against each bacterium. HCA was calculated as Euclidean distances and Ward’s method was used to group extracts and blends, and polyphenolic compounds.
3. Results
The concentrations of polyphenolics identified in the extracts and their blends are shown in . In general, mixtures showed numerical deviations from the expected weighted averages.
Table 2. Concentration obtained of flavonoids and phenolic acids present in the extracts and their mixtures identified by HPLC-DAD (mg/L).
Tabla 2. Concentración obtenida de flavonoides y ácidos fenólicos presentes en los extractos y sus mezclas, identificadas por HPLC-DAD (mg/L).
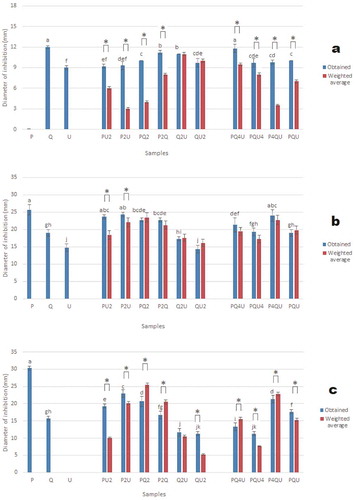
Antibacterial activities of extracts and blends may be seen at , where extracts showed antibacterial activity against all evaluated bacteria, with higher potency on Gram positive than on Gram negative bacteria. The highest activity against E. coli was exerted by extract Q ()). The highest activity against S. aureus was observed with extracts U, P, and binary mixtures P2U, PQ2 and QU2 ()). The optimal antibacterial was composed by Q = 0.10 and U = 0.90 (), Table S1). The extract U, and mixtures PU2, P2U, PQ2, QU2 and PQU, showed the greatest activity against Salmonella spp ()). Synergism was observed in four blends, additivity on three and antagonism on three. The optimum response was when U = 0.49, P = .51 (), Table S1). The highest activity against Pseudomonas spp was obtained with Q and PQ4U ()). Eight of the mixtures showed synergy and two an additive effect. The optimum activity was at Q = 0.91, U = 0.09. The highest activity against L. acidophilus was obtained with P, PU2, P2U, and P4QU ()). Synergy was observed in two mixtures, and an additive effect in eight combinations. The best activity was reached when P = 1.00. The combination of P-U and P-Q have synergistic and additive effects, respectively (), Table S1). The highest activity against B. thermosphacta was shown by extract P ()). Five combinations showed a synergistic effect, Q2U showed an additive effect, and all other combinations showed an antagonistic effect. In the combinations of U-P, U-Q, and P-Q, a decrease gradient of activity is observed as the proportion of pure extract with less antibacterial power increases (), Table S1). The highest activity against B. thermosphacta was shown by extract P ()). Five combinations showed a synergistic effect, Q2U showed an additive effect, and all other combinations showed an antagonistic effect. In the combinations of U-P, U-Q, and P-Q, a decrease gradient of activity is observed as the proportion of pure extract with less antibacterial power increases (), Table S1).
Figure 1. Antibacterial activity of samples against (a) E. coli, (b) S. aureus, and (c) Salmonella spp. Bars indicate obtained values, lines indicate weighted average values corresponding to additive effects.
Figura 1. Actividad antibacteriana de las muestras contra (a) E. coli, (b) S. aureus, (c) Salmonella spp. Las barras indican los valores obtenidos, las líneas indican los valores promedio ponderados correspondientes a los efectos aditivos.
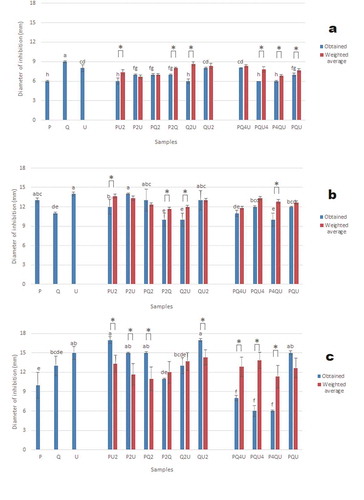
Figure 2. Antibacterial activity of samples against (a) Pseudomonas spp., (b) L. acidophilus, and (c) B. thermosphacta. Bars indicate obtained values, lines indicate weighted average values corresponding to additive effects.
Figura 2. Actividad antibacteriana de las muestras contra (a) Pseudomonas spp., (b) L. acidophilus, (c) B. thermosphacta. Las barras indican los valores obtenidos, las líneas indican los valores promedio ponderados correspondientes a los efectos aditivos.
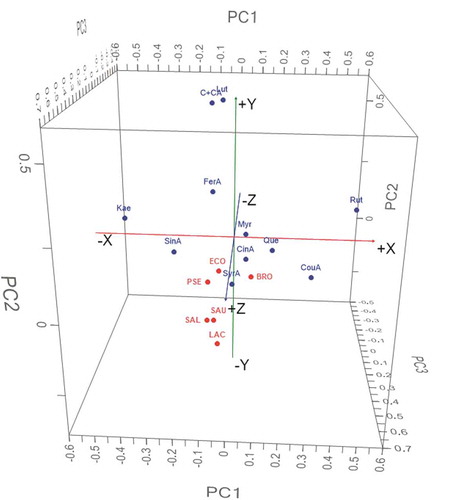
PCA allowed the evaluation of multiparametric correlations between the polyphenolic composition of the extracts and their mixtures, and the antibacterial activity observed ().
4. Discussion
Polyphenolic compositions of extract and their mixtures are very susceptible to changes during extraction process and/or storage. The negative deviations reported in may be due to the degradation of the compounds due to the effect of light, temperature or enzymes derived from the mainly oxidative extraction process. Besides the production of free radicals (Biesaga, Citation2011), which also increases with moisture (Lavelli & Scarafoni, Citation2012) occurs by epimerization (generating a C2 epimeric form) and by autoxidation-forming dimers, which is favored by the presence of oxygen and a large number of hydroxyl groups as in the case of myricetin (Wang & Ho, Citation2009). Flavonoids are sensitive to oxidation due to their hydroxyl and ketone groups, and their unsaturated double bonds (Ramešová et al., Citation2012). One way to protect these compounds would be conducting the extraction in a sweetened medium in the presence of methoxylated groups (Biesaga, Citation2011). On the other hand, positive deviations could occur due to the presence of interfering compounds derived from the processing process, such as sugar and carotenoids (Pękal & Pyrzynska, Citation2014). Some polyphenols appeared in the blends despite not being present in the pure extracts. This may be due to the fact that some polyphenols were degraded and the released molecules were associated by the diode detector as other compounds due to their structure similarity. For example, caffeic acid and p-coumaric acid are derivatives of cinnamic acid, so they could present this problem.
Higher potency on Gram positive than on Gram negative bacteria of extracts are in agreement with Mohdaly, Mahmoud, Roby, Smetanska, and Ramadan (Citation2015) and Khider, Elbanna, Mahmoud, and Owayss (Citation2013) (). The Gram negative bacteria would be more resistant due to the flexibility and greater chemical complexity of their cell walls, the presence of excretory pumps of amphipathic toxins, and greater hydrophobicity.
4.1. Combined antibacterial activity and composition of extracts and blends
The combined antibacterial effects against E. coli varied widely. By means of the response surface plot for the mixtures of Q and P, a decreased gradient of activity from Q to P is observed as the proportion of P increases (), Table S1). In the combinations of Q & U, depending on the proportion, an antagonistic effect is observed (red zone), which is surprising considering that U showed high antibacterial activity. In the combinations of P and U, a higher proportion of U shows an antagonistic effect decreasing the antibacterial activity; this effect was not expected, since U presented greater antibacterial activity than P. The combination of the three extracts shows additive/antagonistic effects, which varies depending on the proportions in which they are mixed. Statistically significant positive correlations were found between Kae, SinA, C + CA, FerA, Lut, and antibacterial activity against E. coli (Table S2). This is consistent with the fact that the phenolic combination with the best antibacterial activity against E. coli was composed by these compounds with rates 1.2: 1.5: 1: 2: 3 (i.e., extract Q). PCA and cluster analysis are consistent with these relations (Figure S3, Table S3). Rodríguez-Vaquero, Aredes Fernández, Manca de Nadra, and Strasser de Saad (Citation2010), however, found that the Que-Rut mixture produces a synergistic effect with cell death in E. coli. In our case, for the mixtures of extracts where both compounds were found to be available (i.e., PU2, P2U, PQ2, P4QU and PQU), no synergistic antibacterial activity was observed; in fact, quite the opposite was observed. It is possible that the accompanying compounds counteract the potential exerted by the combination of both compounds.
Figure 3. Response surface plots of antibacterial activity (mm of inhibition) against (a) E. coli, (b) S. aureus, and (c) Salmonella spp.
Figura 3. Gráficos de superficie de respuesta de actividad antibacteriana (mm de inhibición) contra (a) E. coli, (b) S. aureus, (c) Salmonella spp.
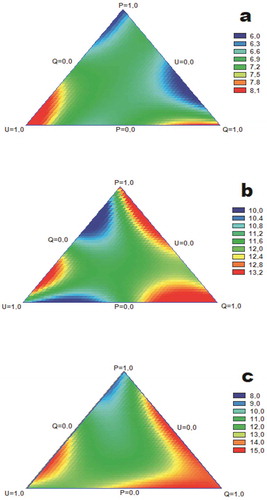
Figure 4. Response surface plots of antibacterial activity (mm of inhibition) against (a) Pseudomonas spp, (b) L. acidophilus, and (c) B. thermosphacta.
Figura 4. Gráficos de superficie de respuesta de actividad antibacteriana (mm de inhibición) contra (a) Pseudomonas spp, (b) L. acidophilus, (c) B. thermosphacta.
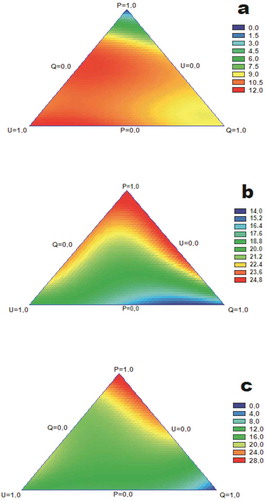
Figure 5. The 3D principal components plot of polyphenolics and antibacterial effects. C+ CA: chlorogenic/caffeic acids, SinA: sinapic acid, FerA: ferulic acid, SyrA: syringic acid, CouA: p-coumaric acid, CinA: cinnamic acid, Lut: luteolin, Rut: rutin, Que: quercetin, Myr: myricetin, Kae: kaempferol, ECO: E. coli, SAU: S. aureus, SAL: Salmonella spp, PSE: Pseudomonas spp, LAC: L. acidophilus, BRO: B. thermosphacta.
Figura 5. Diagrama de componentes principales en 3D de polifenoles y efectos antibacterianos. C + CA: ácidos clorogénico/cafeico, SinA: ácido sinápico, FerA: ácido ferúlico, SyrA: ácido siríngico, CouA: ácido p-cumárico, CinA: ácido cinámico, Lut: luteolina, Rut: rutina, Que: quercetina, Myr: miricetina, Kae: kaempferol, ECO: E. coli, SAU: S. aureus, SAL: Salmonella spp, PSE: Pseudomonas spp, LAC: L. acidophilus, BRO: B. thermosphacta.
Antibacterial effects of mixture against S. aureus showed three zones of synergy. In the combinations of Q-P, as well as U-Q, a decreased gradient of activity is observed as the proportion of Q increases (), Table S1). In the combination P-U, it is noteworthy that the combination of both extracts is not potentiated, presenting an additive effect, which can become antagonistic when the proportion of U is greater (P2U v/s PU2). The combination of the three extracts shows a slight antagonism. Statistically significant correlations were observed between antibacterial activity and Myr, Rut and FerA, but these low correlations indicate that other compounds present in the extracts are acting (Table S1). The phenolic combinations with the highest antibacterial activity were: SinA, FerA, SyrA, Lut and Kae in the ratios of 4: 1: 1: 2: 9 (extract U); and: SinA, FerA, SyrA, CouA, CinA, Lut, Rut, Que, Myr and Kae in the proportions of 1: 1: 1: 6.5: 11.5: 4: 1: 2: 1: 2 (P2U). The antagonistic activity against S. aureus of the Que-Rut mixture (Amin, Khurram, Khattak, & Khan, Citation2015) and the synergistic activity of Myr-Que (Tomás-Menor et al., Citation2015) in systems integrated only by these compounds have been reported. Su, Ma, Wen, Wang, and Zhang (Citation2014), on the other hand, reported mostly additive and sometimes synergistic effects among luteolin-quercetin combinations, depending on the S. aureus species. PCA indicates that the antibacterial activity correlates with C+ CA, FerA, SinA, Lut and Kae, meanwhile cluster analysis relates the effect with all compounds except Rut (, FigureS1, Table S3).
Salmonella spp was controlled depending the combination of extracts and its proportions. In the combinations of U-P, as well as U-Q, a decrease in activity is observed from the proportion of P and Q, respectively. In the combination P-Q, it is striking that there is a zone of proportions that decreases in antibacterial activity, indicating an additive effect without being antagonistic. The combination of the three extracts shows both an additive and an antagonistic effect depending on the proportions in which they are combined. For activity against Salmonella spp, only CinA showed a statistically significant correlation. The low correlation between the concentration of the identified compounds and the observed antibacterial activity indicates that other compounds not identified but present in the extracts are those that would be acting. The phenolic combinations with the highest antibacterial activity against Salmonella spp were: SinA, FerA, SyrA, CouA, CinA, Lut, Rut, Que and Kae in 2.5: 1: 1.5: 4.5: 8: 4: 1: 2: 5.5 (PU2); and, chlorogenic/caffeic acid, SinA, FerA, SyrA, Lut and Kae in rates 1.3: 3.5: 1.5: 1: 3: 7 (QU2). Arima, Ashida, and Danno (Citation2002) observed that Rut would not have direct inhibitory action, but would improve the antibacterial activity of these other flavonoids when mixing them. PCA indicates that the antibacterial activity correlates with C+ CA, FerA, SinA, Lut and Kae, meanwhile cluster analysis relates the effect with all compounds (, FigureS1, Table S3).
Pseudomonas spp. was controlled principally by U and Q extracts. In all combinations, a decrease in activity is observed as the proportion of pure extract with less antibacterial power increases (), Table S1). For the activity against Pseudomonas spp., statistically significant correlations with C+ CA, SinA, Kae, FerA, SyrA, SyrA, CouA, Rut, Myr and Que were found. Phenolic combinations with the highest antibacterial activity were: C+ CA, SinA, FerA, Lut and Kae in the proportions 1.2: 1.5: 1: 2: 3 (extract Q); and, C+ CA, SinA, FerA, SyrA, CouA, Lut, Rut and Kae in proportions 2: 3: 2: 1: 1: 3: 4.5: 5.5 (PQ4U). PCA and cluster analysis correlates the antibacterial with C+ CA, FerA, SinA, Lut and Kae (Figure S3, Table S3).
Antibacterial effects of mixtures against L. acidophilus showed improved results when combinations include P-U or P-Q. These combinations have synergistic and additive effects, respectively (), Table S1). The compounds that correlated statistically with the antibacterial activity shown by the extracts were CouA, SyrA, Rut, Que, Lut, Kae and SinA. These results are consistent with the fact that the phenolic combination with the best antibacterial activity was composed of: FerA, SyrA, CouA, CinA, Lut, Rut, Que and Myr, in proportions 1: 1: 9: 15: 5: 1: 5.5: 1 (extract P); SinA, FerA, SyrA, CouA, CinA, Lut, Rut, Que and Kae in rates 2.5:1:1.5:4.5:8:4:1:2:5.5 (PU2); and: SinA, FerA, SyrA, CouA, CinA, Lut, Rut, Que, Myr and Kae in the proportions of 1: 1: 1: 6.5: 11.5: 4: 1: 2: 1: 2 (P2U). Puupponen-Pimiä et al. (Citation2001) reported that Que, Rut, Kae, and apigenin, and CinA, CouA, caffeic acid, FerA, and chlorogenic acid do not present inhibition on several strains of lactobacilli; however, Myr and Lut have activity against it. PCA and cluster analysis correlates this effect with SyrA, CouA, Rut, Que, CinA and Myr (Figure S3, Table S3).
B. thermosphacta was better controlled when combinations included P extract, and in a high proportion. In the combinations of U-P, U-Q, and P-Q, a decrease gradient of activity is observed as the proportion of pure extract with less antibacterial power increases (), Table S1). Higher correlations were found between antibacterial activity and compounds: CouA, Que, CinA, Myr, SyrA, Lut, Rut, Kae and SinA. The phenolic combination with the best antibacterial activity against B. thermosphacta was composed of: FerA, SyrA, CouA, CinA, Lut, Rut, Que and Myr, in proportions 1: 1: 9: 15: 5: 1: 5.5: 1 (extract P). PCA and cluster analysis correlates this effect with Syr, CouA, CinA, Rut, Que and Myr (Figure S3, Table S3).
The present study has demonstrated the antibacterial activity of polyphenolic extracts of honeys and pollen and their mixtures. Unlike what was expected, greater antibacterial activity was observed in the individual extracts than in the mixtures. When they were mixed, better results were observed when the pollen extract was combined with a single extract of honey (Ulmo or Quillay). In ternary mixtures, the effect of a second honey extract decreased the antibacterial response in most cases. The antibacterial synergism/antagonism of mixtures of phenolic extracts needs further investigation taking into account variables such as the quality, type and concentration of the extractant solvents, and the individual phenolic and flavonoid compounds, as well as their kinetics.
The chemometric analysis allowed associating the antibacterial effect with some compounds over others. However, the antibacterial activity is the result of complex processes that go beyond being the additive result of the individual or total concentration of phenolic compounds. It is necessary in the future to isolate specific bioactive compounds by bioassay guided fractionation and further characterize the extracts, as well as the mechanism of their antibacterial activity. It is also necessary to consider the type of bacteria to be evaluated and their level of susceptibility, as well as to analyze the response of these mixtures of compounds in food models to evaluate their applicability as food preservatives.
Declaration of interest statement
No potential conflict of interest was reported by the authors.
Supplemental Material
Download MS Word (560.1 KB)Acknowledgments
The authors thank for financial support to: FIC Regional IDI 30126395-0 Región del Libertador Bernardo O’Higgins; Proyecto interdisciplinario UC-VRI Nº13, 2013; CONICYT Beca Doctorado Nacional Nº 21110822; Healthy Food Matrix Design, Anillo ACT 1105/2012; PAI-CONICYT Tesis de Doctorado en la Empresa Nº 781412002.
Supplementary material
Supplemental data for this article can be accessed here.
Additional information
Funding
Related Research Data
References
- Amin, M. U., Khurram, M., Khattak, B., & Khan, J. (2015). Antibiotic additive and synergistic action of rutin, morin and quercetin against methicillin resistant Staphylococcus aureus. BMC Complementary and Alternative Medicine, 15(1), 59. doi:10.1186/s12906-015-0580-0
- Arima, H., Ashida, H., & Danno, G. I. (2002). Rutin-enhanced antibacterial activities of flavonoids against Bacillus cereus and Salmonella enteritidis. Bioscience, Biotechnology, and Biochemistry, 66(5), 1009–1014. doi:10.1271/bbb.66.1009
- Baljeet, S. Y., Simmy, G., Ritika, Y., & Roshanlal, Y. (2015). Antimicrobial activity of individual and combined extracts of selected spices against some pathogenic and food spoilage microorganisms. International Food Research Journal, 22(6), 2594–2600.
- Balouiri, M., Sadiki, M., & Ibnsouda, S. K. (2016). Methods for in vitro evaluating antimicrobial activity: A review. Journal of Pharmaceutical Analysis, 6(2), 71–79. doi:10.1016/j.jpha.2015.11.005
- Bassolé, I. H. N., & Juliani, H. R. (2012). Essential oils in combination and their antimicrobial properties. Molecules, 17(4), 3989–4006. doi:10.3390/molecules17043989
- Biesaga, M. (2011). Influence of extraction methods on stability of flavonoids. Journal of Chromatography A, 1218(18), 2505–2512. doi:10.1016/j.chroma.2011.02.059
- Cabrera, C., & Montenegro, G. (2013). Pathogen control using a natural Chilean bee pollen extract of known botanical origin. Ciencia E Investigacion Agraria, 40(1), 223–230. doi:10.4067/S0718-16202013000100020
- Chen, M., Zhao, Z., Meng, H., & Yu, S. (2017). The antibiotic activity and mechanisms of sugar beet (Beta vulgaris) molasses polyphenols against selected food-borne pathogens. LWT- Food Science and Technology, 82, 354–360. doi:10.1016/j.lwt.2017.04.063
- Cox, S. D., Mann, C. M., & Markham, J. L. (2001). Interactions between components of the essential oil of Melaleuca alternifolia. Journal of Applied Microbiology, 91(3), 492–497. doi:10.1046/j.1365-2672.2001.01406.x
- Davidson, P. M., & Taylor, T. M. (2007). Chemical preservatives and natural antimicrobial compounds. In M. P. Doyle & I. R. Beuchat (Eds.), Food microbiology: Fundamentals and frontiers (3rd ed., pp. 713–745). Washington, DC: ASM Press.
- Doern, C. D. (2014). When does 2 plus 2 equal 5? A review of antimicrobial synergy testing. Journal of Clinical Microbiology, 52(12), 4124–4128. doi:10.1128/JCM.01121-14
- Granato, D., Do Prado-Silva, L., Alvarenga, V. O., Zielinski, A. A., Bataglion, G. A., de Morais, D. R., & Sant’Ana, A. D. S. (2016). Characterization of binary and ternary mixtures of green, white and black tea extracts by electrospray ionization mass spectrometry and modeling of their in vitro antibacterial activity. LWT-Food Science and Technology, 65, 414–420. doi:10.1016/j.lwt.2015.08.037
- Khider, M., Elbanna, K., Mahmoud, A., & Owayss, A. A. (2013). Egyptian honeybee pollen as antimicrobial, antioxidant agents, and dietary food supplements. Food Science and Biotechnology, 22(5), 1–9. doi:10.1007/s10068-013-0238-y
- Kumar, S., & Pandey, A. K. (2013). Chemistry and biological activities of flavonoids: An overview. The Scientific World Journal, 1, 1–23.
- Lavelli, V., & Scarafoni, A. (2012). Effect of water activity on lycopene and flavonoid degradation in dehydrated tomato skins fortified with green tea extract. Journal of Food Engineering, 110(2), 225–231. doi:10.1016/j.jfoodeng.2011.05.025
- Mandalari, G., Bennett, R. N., Bisignano, G., Trombetta, D., Saija, A., Faulds, C. B., & Narbad, A. (2007). Antimicrobial activity of flavonoids extracted from bergamot (Citrus bergamia Risso) peel, a byproduct of the essential oil industry. Journal of Applied Microbiology, 103(6), 2056–2064. doi:10.1111/j.1365-2672.2007.03456.x
- March, G. A., & Bratos, M. A. (2015). A meta-analysis of in vitro antibiotic synergy against Acinetobacter baumannii. Journal of Microbiological Methods, 119, 31–36. doi:10.1016/j.mimet.2015.09.014
- Mohdaly, A. A., Mahmoud, A. A., Roby, M. H., Smetanska, I., & Ramadan, M. F. (2015). Phenolic extract from propolis and bee pollen: Composition, antioxidant and antibacterial activities. Journal of Food Biochemistry, 39(5), 538–547. doi:10.1111/jfbc.12160
- Montenegro, G., Gómez, M., Casaubon, G., Belancic, A., Mujica, A. M., & Peña, R. C. (2009). Analysis of volatile compounds in three unifloral native Chilean honeys. va. Phyton, 78, 61–65.
- Montenegro, G., Santander, F., Jara, C., Nuñez, G., & Fredes, C. (2013). Actividad antioxidante y antimicrobiana de mieles monoflorales de plantas nativas chilenas. Boletín Latinoamericano y del Caribe de plantas medicinales y aromáticas, 12(3), 257–268.
- Montenegro, R. G. (2011). Uses of unifloral ulmo honey extract as a bactericide and a fungicide. WO/2011/0571421.
- National Committee for Clinical Laboratory Standards (NCCLS). (2002). Performance standards for antimicrobial susceptibility testing; 12th informational supplement, M100-S12. Wayne.
- Ncube, B., Finnie, J. F., & Van Staden, J. (2012). In vitro antimicrobial synergism within plant extract combinations from three South African medicinal bulbs. Journal of Ethnopharmacology, 139(1), 81–89. doi:10.1016/j.jep.2011.10.025
- Pękal, A., & Pyrzynska, K. (2014). Evaluation of aluminium complexation reaction for flavonoid content assay. Food Analytical Methods, 7(9), 1776–1782. doi:10.1007/s12161-014-9814-x
- Puupponen-Pimiä, R., Nohynek, L., Meier, C., Kähkönen, M., Heinonen, M., Hopia, A., & Oksman-Caldentey, K. M. (2001). Antimicrobial properties of phenolic compounds from berries. Journal of Applied Microbiology, 90(4), 494–507.
- Ramešová, Š., Sokolová, R., Degano, I., Bulíčková, J., Žabka, J., & Gál, M. (2012). On the stability of the bioactive flavonoids quercetin and luteolin under oxygen-free conditions. Analytical and Bioanalytical Chemistry, 402(2), 975–982. doi:10.1007/s00216-011-5504-3
- Rodríguez-Vaquero, M. J., Aredes Fernández, P. A., Manca de Nadra, M. C., & Strasser de Saad, A. M. (2010). Phenolic compound combinations on Escherichia coli viability in a meat system. Journal of Agricultural and Food Chemistry, 58(10), 6048–6052. doi:10.1021/jf903966p
- Salawu, S. O., Ogundare, A. O., Ola-Salawu, B. B., & Akindahunsi, A. A. (2011). Antimicrobial activities of phenolic containing extracts of some tropical vegetables. Journal of Pharmacy and Pharmacology, 5(4), 486–492.
- Su, Y., Ma, L., Wen, Y., Wang, H., & Zhang, S. (2014). Studies of the in vitro antibacterial activities of several polyphenols against clinical isolates of methicillin-resistant Staphylococcus aureus. Molecules, 19(8), 12630–12639. doi:10.3390/molecules190812630
- Tomás-Menor, L., Barrajón-Catalán, E., Segura-Carretero, A., Martí, N., Saura, D., Menéndez, J. A., … Micol, V. (2015). The promiscuous and synergic molecular interaction of polyphenols in bactericidal activity: An opportunity to improve the performance of antibiotics? Phytotherapy Research, 29(3), 466–473. doi:10.1002/ptr.5296
- Velásquez, P., Rodríguez, K., Retamal, M., Giordano, A., Valenzuela, L. M., & Montenegro, G. (2017). Relation between composition, antioxidant and antibacterial activities and botanical origin of multi-floral bee pollen. Journal of Applied Botany and Food Quality, 90, 306–314.
- Wagner, H. (2009). Synergy research: Approaching a new generation of phytopharmaceuticals. Phytomedicine, 16(2–3), 97–110. doi:10.1016/j.phymed.2008.12.018
- Wang, Y., & Ho, C. (2009). Polyphenolic chemistry of tea and coffee: A century of progress. Journal of Agricultural and Food Chemistry, 57(18), 8109–8114. doi:10.1021/jf804025c