
ABSTRACT
The present study aims to characterize twenty-seven Staphylococcus aureus isolates among a total of forty-four Staphylococci recovered from raw milk and traditional artisanal dairy foods (n = 285) in Central Anatolia and the Mediterranean Regions of Turkey, using MALDI-TOF MS-based phyloproteomic principal component analysis (PCA). The data shown by the spectra were analyzed, followed by composite correlation index (CCI), virtual gel, and cluster analysis for validation. The correlation between standard strain S. aureus 25,923 THL (SA-18) and all strains was significant since protein peak of m/z 5305 ± 2 Da was common in all strains, including SA-18. Twenty-six (9.12%) and fifteen (5.26%) out of all samples were found as contaminated by Staphylococci and S. aureus, respectively. The findings suggest that MALDI-TOF MS-based PCA is a promising fast method to categorize S. aureus in dairy foods, in need of continuous monitoring of foodborne pathogens for public health.
El presente estudio tuvo por objeto caracterizar 27 aislados de Staphylococcus aureus entre un total de 44 estafilococos recuperados de leche cruda y alimentos lácteos artesanales tradicionales (n=285) en Anatolia Central y las regiones mediterráneas de Turquía. Para ello se utilizó el análisis de componentes principales (PCA) filoproteómico, basado en la EM MALDI-TOF. Se analizaron los datos mostrados por los espectros, seguidos por el índice de correlación compuesto (CCI), el gel virtual y el análisis de clúster para su validación. Se constató que la correlación entre la cepa estándar S. aureus 25923 THL (SA-18) y todas las cepas fue significativa, ya que el pico proteico de m/z 5305 ± 2 Da fue común a todas ellas, incluida la SA-18. De todas las muestras analizadas, 26 (9.12%) resultaron contaminadas por estafilococos y 15 (5.26%) por S. aureus. Los resultados dan cuenta de que el PCA basado en la EM MALDI-TOF es un método rápido y prometedor para categorizar S. aureus en los alimentos lácteos que requieren, para garantizar la salud pública, un seguimiento continuo de los patógenos transmitidos por los alimentos.
1. Introduction
The genus Staphylococcus consists of forty-nine validly described species and twenty-two subspecies that are ubiquitous in nature and can colonize and/or infect various animals (Schmidt et al., Citation2018; Trülzsch et `al., Citation2007). Among them, Staphylococcus aureus (S. aureus) is an important pathogen that causes several diseases, such as toxic shock syndrome, pneumonia, bacteremia, infective endocarditis (IE), abscess, sepsis, and Staphylococcal foodborne poisoning (SFP) (J.-M. Kim et al., Citation2019; Tong et al., Citation2015). SFP is one of the most common foodborne diseases worldwide which is characterized by gastrointestinal symptoms, including nausea, vomiting, abdominal pain, and diarrhea (Balaban & Rasooly, Citation2000; Hennekinne et al., Citation2012; Kooken et al., Citation2014).
Any food of animal origin can be contaminated by S. aureus. However, raw milk and dairy foods are the leading food groups since milk-producing animals are the most important sources of S. aureus contamination, in addition to the risks of contamination such as human handling, milking equipment, and also the environment (Böhme et al, Citation2012; Cortimiglia et al., Citation2015; Fagundes et al., Citation2010; Jamali et al., Citation2015). Besides, its increasing antibiotic resistance also makes it a bigger worldwide problem (Böhme et al., Citation2012).
The presence of S. aureus in raw milk and thereof dairy foods seems to remain an ongoing challenge to public health due to the frequency of outbreaks attributed to raw milk and dairy foods that have still been considerable in the last decades (Gonzales-Barron et al., Citation2017). The presence of S. aureus in milk generally indicates the post-secretory contamination due to the poor hygienic conditions that the milk was produced but also may indicate udder inflammation since it is one of the major causes of mastitis in cows and other domestic dairy ruminants (Böhme et al., Citation2012; Gonzales-Barron et al., Citation2017). The presence of S. aureus in milk and dairy foods puts consumers at health risk and results in high economic losses due to reduced milk production and quality imposes, and also recalls of implicated dairy foods. In this sense, early and rapid identification of S. aureus contamination of raw milk and dairy foods is an important issue not only for public health to minimize the risk of foodborne illness and to initiate the most appropriate antimicrobial therapy but also for the dairy sector to assure dairy food quality and to avoid economic losses (Fagerquist et al., Citation2009).
Manual and/or automated identification techniques based on biochemical assays and phenotypic determination include multiple subcultures and require up to a week to obtain ascertain reactivity of the bacteria with specific biochemical tests and thereof are labor-intensive and costly (Dingle & Butler-Wu, Citation2013; Zhu et al., Citation2015). Besides, they may lack efficient discriminatory power to distinguish among Staphylococci strains since these bacteria exhibit great variability in the expression of biochemical properties, and isolates having aberrant features can be misidentified or unrecognized (E. Kim et al., Citation2021; Sauget et al., Citation2017; Trülzsch et al., Citation2007; Wanecka et al., Citation2019). However, matrix-assisted laser desorption/ionization time-of-flight mass spectrometry (MALDI-TOF MS) has been demonstrated to be applicable for routine bacterial identification in achieving correct species identification of 92% of isolates, significantly better than the identification of 83.1% of isolates by conventional methods (Böhme et al., Citation2012; Dingle & Butler-Wu, Citation2013). In addition, conventional methods produced more incorrect genus-level identifications (1.6%) compared with MALDI-TOF MS technique (0.1%) (Van Veen et al., Citation2010).
When these conventional techniques are unable to identify Staphylococci strains, 16 S rRNA and 18 S rRNA sequencing based on different PCR-based assays and micro-nuclear magnetic resonance (µNMR) sequencing can be performed, but these also require additional biological culture, DNA extraction, and amplification, or sequencing steps and thereof often result in longer turnaround times and significant expenses (Khater et al., Citation2021; Manukumar & Umesha, Citation2017; Peruzy et al., Citation2019; Rychert, Citation2019). Besides, no molecular-based techniques are currently available for S. aureus subspecies differentiation and this makes the MALDI-TOF MS technique rapid and accurate method to overcome the challenges of subspecies identification of bacterial pathogens (Pérez-Sancho et al., Citation2018).
MALDI-TOF MS is a sensitive alternative to biochemical and even molecular-based identification approaches since it requires fewer reagents, fewer steps, and less prior information about the microorganism than those methods (Bittar et al., Citation2009; Cheng et al., Citation2016; Elbehiry et al., Citation2017). Furthermore, it has emerged as a rapid, accurate, easy-to-apply, high-throughput, and cost-effective technique for microbial identification and diagnosis (Sauget et al., Citation2017; Wang et al., Citation2013; Zhu et al., Citation2015). Once the microbial samples are ready, the determination of species takes only a few minutes (Sauget et al., Citation2017). Microorganisms are identified using either cell extracts or intact cells in this proteomic assay (Manukumar & Umesha, Citation2017) which relies on the generation of unique protein profiles (protein fingerprints) captured from small amounts of bacterial colony material, followed by software-assisted searching of an inbuilt proprietary database of well-characterized reference strains (Braga et al., Citation2018; Cameron et al., Citation2017; Sauget et al., Citation2017). Since it detects a large spectrum of proteins, the assay can discriminate between closely related species and also classify microorganisms at the subspecies level (Murray, Citation2010). In addition, as the technology has evolved, the expansion of the databases containing spectra of known microorganisms has allowed for the identification of bacterial species with similar phenotypic, genotypic, and biochemical properties that was not previously possible to identify (Rychert, Citation2019).
Food and Drug Administration (FDA) confirmed that MALDI-TOF MS is an approved technique for identification and discrimination of various pathogens through ionization of the extracted molecules of the entire microorganism culture without specific protease treatment (Cheng et al., Citation2016). While the MALDI-TOF MS technique is widely used in clinical samples to obtain the molecular fingerprints of the microorganisms (Clark et al., Citation2013; Fagerquist et al., Citation2009), it has still not gained enough popularity in the analysis of foodborne microorganisms although it can be easily implemented into routine food analysis since all types of foodborne microorganisms can be processed with the same protocol. However, the rapid identification and classification of S. aureus is an important issue for public health and the dairy sector to avoid food safety hazards and economic losses and to have an opinion about the sources of strains that perform a foremost role in SFP.
Traditionally manufactured artisanal dairy foods such as White-pickled cheeses, Tulum cheeses, clotted creams, and Maras ice-creams [made with adding mastic resin and salep (a type of flour made from the root of the early purple orchid that is only native to Turkey) in a high ratio of 1:50– 1:60 to goat milk that makes it a viscous, almost sticky consistency] are very popular in Turkey. Among them, the main use of milk is in traditional dairy food production on artisanal cheeses, at the farm level, or by cheese industries working at the regional level. The small-scale production of these traditional artisanal dairy foods requires extensive manual processing by the dairy workers, usually under neglected hygienic conditions which favor the growth of S. aureus. Studies on the presence of S. aureus both in raw milk and in these dairy foods are important to promote food safety, however, information about S. aureus isolated from artisanal cheeses and its sources of production in small-scale dairies is very limited (Castro et al., Citation2020; Gonzales-Barron et al., Citation2017). Moreover, their characterization contributes to a better understanding of S. aureus and to the development of measures to control and prevent their dissemination in dairy foods.
Therefore, this study firstly focused on isolating S. aureus from raw milk and some traditional artisanal dairy foods in Central Anatolia and the Mediterranean Regions of Turkey and then aimed to characterize them in terms of their mass spectra by evaluating the efficacy of the MALDI-TOF MS method since the MALDI-TOF MS identification of microorganisms reduced the chances of human error that can result from interpretation of data from microscopic, biochemical, and phenotypic analysis (Cheng et al., Citation2016). In addition, the topology of the dendrogram was created by MALDI Biotyper 3.0 software, Composite Correlation Index, and variance analysis, and the proximity-distance relationships of each strain with each other were revealed.
2. Materials and methods
2.1. Bacterial isolates and culture conditions
During the examination period, ninety-nine presumptive S. aureus isolates were recovered from a total of 285 samples of raw milk and unpackaged artisanal dairy foods [raw milk (50 samples), traditional cheeses consisting of White-pickled cheese (50 samples), and Tulum cheese (50 samples), yogurt (25 samples), butter (25 samples), traditional clotted cream (20 samples), pastry cream (50 samples), and traditional Maras ice-cream (15 samples)] which were collected on a random basis at various villagers, local bazaars, retail outlets, and raw milk collection areas in Central Anatolia and the Mediterranean Regions of Turkey over an 15 months period from January 2020 to April 2021 by culturing on non-selective and selective growth media, based on the standard EN/ISO 6888–1 (01/2004). Typical colonies (black, shiny, convex colonies with 2–5 mm clear zones, with or without an opaque zone) and even the colonies that were not likely to be typical were investigated to ensure that no cultured Staphylococci were inadvertently missed from subsequent analysis. In the samples with more than one colony-forming unit (CFU), all colonies were selected for MALDI-TOF MS identification.
2.2. Quality checks of MALDI spectra
Internal and external quality checks (QC) were performed before using MALDI-TOF MS to identify ninety-nine presumptive S. aureus isolates. Internal QC of MALDI-TOF MS analysis consists of an automatic instrument calibration using a manufacturer-specified calibration standard. For this, all targets were calibrated using the Bruker Bacterial Test Solution (Bruker BTS) (Bruker Daltonics Inc., Germany), consisting of Escherichia coli (E. coli) ATCC 25922. During calibration, the calibrator generates and automatically analyzes a mass spectrum to check the spectrum baseline and ensure the expected calibration peaks are present. The calibrator spectrum also runs against the reference database to ensure the correct identification is given with a level of confidence that meets the manufacturer’s specifications. For external QC of MALDI-TOF MS analysis, S. aureus 25,923 THL (SA-18) was tested as positive control using the same methodology. Mass spectra calibration in this study was successfully completed with seven peaks (m/z; 5096.39131 Da, 5381.29948 Da, 6255.88237 Da, 7274.94890 Da, 10299.98287 Da, 13682.31900 Da, and 16952.87711 Da) assigned with a standard deviation of 60.52 ppm and a maximum peak error of 80.19 ppm. To confirm that there is no reagent contamination and/or no residual bacterial material from a previous run remained, and that the target plate has been adequately cleaned between runs, one spot on each target contained the only matrix as a negative control with no bacterial sample.
2.3. Sample preparation and MALDI TOF MS identification of Staphylococci isolates
Identification of ninety-nine presumptive isolates was done via their unique protein profiles (mass spectra) which are generated by the MALDI-TOF MS device (Bruker Microflex LT, Germany) and then matched to the Main Spectrum Profile (MSP) reference database library (MALDI Biotyper database) of known microbial spectra. The MALDI Biotyper Real-Time Classification (RTC) was carried out by a special bioinformatics MALDI Biotyper software (version 3.1) and mass spectra reviews were carried out by FlexAnalysis software (version 3.4).
For microbial biomass analysis, the direct transfer method previously described by Cameron et al. (Citation2017) was used. For this, a single colony was taken from each presumptive isolate with the help of a single-use, 15-cm sterile wooden applicator stick and placed onto a ground steel MSP 96-spot target (Bruker Daltonics Inc., Germany) by smearing a thin film of colony material. The spots were allowed to air dry at room temperature. Next, the spots were overlaid with 1.0 µL of a saturated solution of the α-cyano-4-hydroxycinnamic acid matrix (HCCA matrix) in 50% acetonitrile, 47.5% water, and 2.5% trifluoroacetic acid (Sigma-Aldrich Inc., Germany) using single-use pipette tips and then were air-dried at room temperature. Subsequently, the MSP 96-spot target was placed in the MALDI-TOF MS device, and the system was operated using the optimized method for the identification of microorganisms in linear positive ion mode within a mass range of 2 000 to 20,000 Da. Proteins having a mass spectrum represented by m/z in this range are utilized for the identification of bacterial strains based on individual mass peaks corresponding to specific ribosomal proteins of distinct types of microorganisms. A 60 Hz nitrogen laser was employed at 337 nm as the ion source. To obtain each spectrum from different areas of the sample spot, 240 laser shots in 40-shot steps were made and analyzed using default settings. Each sample was studied in triplicate and the highest readings were included in the analysis.
The results were reported as numeric scores based on similarity with the reference spectra based on a proprietary algorithm of MALDI Biotyper software (version 3.1) comparing the presence and symmetry of peaks in the mass spectra of the unknown strain and the database strain entries. The log scale from 0.000 to 3.000 defines the identification matching level with the database. Identification scores were interpreted as per manufacturer’s recommendations as follows: scores between 2.300–3.000 are designated as “highly probable species identification”, scores between 2.000–2.299 as “probable species identification”, scores of 1.700–1.999 as “probable genus identification”, and scores below 1.699 are reported as “non-reliable genus identification”. The closest matches were listed in order of these score values and the highest one indicated the highest similarity in the mass spectra (Cameron et al., Citation2017; Cheng et al., Citation2016; Horváth et al., Citation2020).
MALDI-TOF MS identification elicits the characteristic mass and peak density distribution of ribosomal 16S proteins in the sample. Since this mass spectrum is species-specific for many microorganisms, it also represents a “molecular fingerprint” (Cheng et al., Citation2016; Sauget et al., Citation2017).
2.4. Mass spectrum profile and phyloproteomic PCA analysis of S. aureus and other Staphylococci
The mass spectra generated from MALDI-TOF MS are regarded as multivariate data, in which every mass signal represents a single molecular dimension. Therefore, multivariate statistical methods are generally used for differentiation between bacterial species (Samad et al., Citation2020). Accordingly, the mass spectra obtained in this study were further analyzed to determine the composite correlation index (CCI) which was used to statistically determine the relationship between the acquired spectra. This virtual gel view represented all peaks found in a spectral file and was used to identify common peaks between different spectra of the Staphylococci strains used in this study.
Mass spectrum was analyzed using the phyloproteomic PCA method supported by external MATLAB software integrated into the MALDI Biotyper software (version 3.1). Phyloproteomic PCA was performed to decrease the dimensionality of the data set and maintain the original information present. The PCA was based on the peaks acquired from MALDI-TOF MS to find the patterns and unique peaks of individual strains and allows the formation of clustered groups of spectra having similar variation characteristics and the visualization of the differences between them. The data was represented in a 3D coordinate system. Optimized preliminary procedures were applied for each spectrum in order to accelerate the analysis and reduce the data mass dimension. Cluster analysis was performed by performing PCA dendrograms which represent the relationship and proximity of each spectrum to each other (Cheng et al., Citation2016).
All the analysis (PCA and dendrograms) was carried out as per the standard operating procedure for the instrument and built-in software. The raw mass spectra were pre-processed by MALDI Biotyper software (version 3.1) before further analysis based on the Biotyper pre-processing standard method (smoothing method: Savitski-Golay; baseline subtraction method: multi polygon; normalization method) (Jeong et al., Citation2013). Any individual spectrum with poor quality (having background noise or too high/low intensities) was excluded. The MSP dendrograms were generated using the Biotyper MSP dendrogram creation standard methods. A PCA-based approach was used to increase the share of peaks separating and reducing the weighting of the common peak in the data sets from closely related organisms.
3. Results and discussion
3.1. MALDI-TOF MS identification of Staphylococci isolates
In the present study, ninety-nine presumptive isolates from two hundred and eighty-five raw milk and traditional artisanal dairy food samples were analyzed by MALDI-TOF MS. includes the results of identification of isolates by MALDI-TOF MS, including the type of dairy foods and MALDI-TOF MS identification scores. S. aureus 25,923 THL (SA-18) was used as the standard strain in MALDI-TOF MS analysis. Accordingly, identification at the highly probable species level (MS scores ≥2.300) was secure in 13.6% isolates (SA-1, SA-2, SA-3, SA-4, SA-20, SX-1), and the majority, 40.9% of the isolates (SA-5, SA-8, SA-9, SA-10, SA-13, SA-16, SA-18, SA-21, SA-23, SA-24, SA-26, SA-27, SCH-2, SCH-3, SCH-4, SE, SH, SX-3) gave MS scores ≥2.000 with a probable species level. In other words, totally 54.5% of the isolates were accurately distinguished and reliably identified at the species level. Identification at the genus level (MS scores ≥1.700) was secure in 38.6% of isolates (SA-6, SA-7, SA-11, SA-12, SA-14, SA-17, SA-19, SA-22, SA-25, SA-28, SCR-1, SCR-2, SP-1, SP-2, SW-2, SW-3, SX-2). Briefly, most of the forty-four isolates (93.1%) except the isolates of SW-1, SA-15, SCU, and SCH-1 were identified as Staphylococcus spp. (MS scores ≥1.700). In the case of the isolates of SW-1, SA-15, SCU, and SCH-1, the scores obtained were within the range of non-reliable genus identification (MS scores ≤1.699), but each of them was settled in their respective clusters in a dendrogram and 3D scatter graphic during the PCA analysis. In addition, CCI affinity rates of these four isolates with SA-18 strain were determined as 31%, 45%, 71%, and 67%, respectively.
Table 1. Identification of Staphylococci Isolates by MALDI-TOF MS.
Tabla 1. Identificación de los aislados de estafilococos mediante EM MALDI-TOF
The samples were categorized as S. aureus-positive if at least one CFU was isolated. Out of ninety-nine presumptive isolates, twenty-seven S. aureus among forty-four Staphylococci were identified by MALDI-TOF MS. The rest of the isolates were mainly identified as either Macrococcus caseolyticus or Enterococcus faecalis. Among twenty-seven S. aureus, one (SA-25) was isolated from a raw milk (RM27), thirteen (SA-1, SA-2, SA-3, SA-4, SA-8, SA-9, SA-11, SA-14, SA-15, SA-16, SA-20, SA-24, SA-28) from seven different White-pickled cheeses (WPC1, WPC5, WPC11, WPC23, WPC37, WPC39, and WPC46), six (SA-6, SA-7, SA-10, SA-12, SA-13, and SA-27) from 3 different Tulum cheeses (TC3, TC20, and TC29), and seven (SA-17, SA-19, SA-21, SA-22, SA-23, SA-25, and SA-26) from four different pastry cream samples (PC21, PC33, PC41, and PC44). In other words, 2% of raw milk, 14% of White-pickled cheeses, 6% of Tulum cheeses, and 8% of pastry cream samples were found as contaminated by S. aureus by MALDI-TOF MS. The result of S. aureus-positive traditional artisanal cheeses (20%) in this study were higher compared to the finding (11.1%) of Rahimi (Citation2013) with traditional cheeses. This could be due to unsanitary applications during artisanal processing and storage practices. Likewise, Johler et al. (Citation2018) found 80% of artisanal raw milk cheese as positive for S. aureus by showing the entrance of S. aureus into the artisanal cheese-making process at different stages of the manual production, with colonized cheese makers representing a likely source of it. Overall, 15 out of 285 samples (5.26%) were found as contaminated by S. aureus by MALDI-TOF MS. This is also consistent with the results of our previous study by API 32 system (bioMérieux, France) and polymerase chain reaction (PCR).
According to results of other identified Staphylococci, WPC12 and PC6 were found to be contaminated by S. pasteuri (SP-1 and SP-2, respectively), WPC34, TC31, and PC35 by S. warneri (SW-1, SW-2, and SW-3 respectively), WPC37 by S. cohnii (SCU), WPC46 by S. epidermidis (SE), TC3 and TC14 by S. carnosus (SCR-1 and SCR-2, respectively), TC50, RM22, RM30, and RM47 by S. chromogenes (SCH-4, SCH-1, SCH-2, and SCH-3 respectively), PC27 by S. xylosus (SX-1, SX-2, SX-3), RM30 by S. haemolyticus.
In some traditional artisanal dairy foods such as yogurt, butter, clotted cream, and Maras ice cream samples, no S. aureus was isolated. However, Rahimi (Citation2013) found 5.9% of traditional ice cream, 5.6% of cream, and 5.3% of butter samples contaminated with S. aureus. This can be attributed to the dairy farm management of environmental and personal hygiene practices essential in the production process. In the case of yogurt samples, this may arise either from the increase in lactic acid and titrimetric acidity, as well as a decrease in pH value during fermentation and subsequent cold storage (at 4°C for ≥48 h) of yogurts or from the low initial contamination levels (<102 S. aureus cells) of samples (Pazakova et al., Citation1997). Nevertheless, this is rather due to the presence of metabolites formed by starter cultures during milk fermentation, especially to the concentration of lactic acid, than to the low pH value (Pazakova et al., Citation1997; Zúñiga Estrada et al., Citation1999). Since butter and clotted creams are often thought to be unsatisfactory media for survival and growth of S. aureus depending on the combined effect of their high (80–90% and 60–65%, respectively) milk fat content and subsequent cold storage (at 4°C), starter cultures used in their production can also effectively prevent the growth of S. aureus (Hennekinne et al., Citation2012). In addition, Wilson et al. (Citation1997) and Hu et al. (Citation2013) also did not detect S. aureus in ice cream samples which are consistent with the findings of our study. The reason for S. aureus-negative Maras ice cream samples can probably be because of the proven antimicrobial effect of bioactive compounds (capronaldehyde, 2(E)-hexenal, limonene, heptanal, pelargonaldehyde, decane, and etc.) of salep orchids, of its storage at such low temperatures – unlike other dairy products, and of greater care that is taken in handling them (Erik et al., Citation2020). However, this must not lead to lowering of hygiene standards during the production, packaging, storage, and distribution of these dairy foods. In this study, the presence of S. aureus in raw milk was 2% which is lower compared to the studies with raw milk samples (7.3%) in Brazil (Fagundes et al., Citation2010), 9.1% in northern Italy (Riva et al., Citation2015), 25.53% in Bangladesh (Jahan et al., Citation2015), 42% in Egypt (Ahmed et al., Citation2019), and >60% in Malaysia (Chye et al., Citation2004). This may be due to the severe inspection measures for monitoring the informal sale of dairy foods in Turkey since there is a legal prohibition of raw milk sales by street vendors in Turkey. Therefore, raw milk can only be sold in Turkey by specially licensed farms and dairy companies require special labeling rules and undergo regular tests to control the microbial content of raw milk.
3.2. Spectral inspection and PCA of S. aureus and other Staphylococci
Generally, three readings were performed for each isolate and the analysis of forty-five Staphylococci (including SA-18) spectra with the highest score were performed. A protein peak of m/z 5305 ± 2 Da was found as common in all forty-four isolates during the examination by FlexAnalysis software (version 3.4). Besides, protein peaks of m/z 3430 Da was found in S. aureus, S. haemolyticus, and S. carnosus; m/z 6890 Da was found in S. aureus, S. carnosus, S. epidermidis, S. warneri, and S. cohnii; m/z 8094 Da was found in S. aureus, S. haemolyticus, S. carnosus, S. chromogenes, and S. pasteuri; and m/z 9633 Da was found in S. epidermidis, S. warneri, S. cohnii, and S. pasteuri.
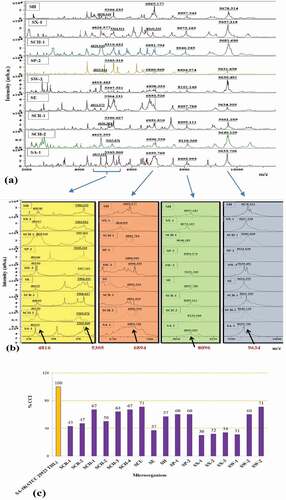
Each of the spectra of nine randomly selected other Staphylococci found to have different protein peak values (). However, common protein peaks were also observed within them (). As shown in , while 5305 ± 2 Da was determined to be specific biomarkers for S. aureus was present in all of the nine Staphylococci, the protein peaks of 4816 Da, 6894 Da, 8096, 9634 Da differ by ± 20 Da in SA-18. CCI relation was also evaluated according to SA-18 with the MALDI-TOF mass spectra of seventeen other Staphylococci identified as S. carnosus, S. chromogenes, S. cohnii, S. epidermidis, S. haemolyticus, S. pasteuri, S. xylosus, and S. warneri. Accordingly, S. chromogenes, S. cohnii, S. haemolyticus, S. pasteuri, and S. warneri were found to be more than 50% similar to SA-18 (). This similarity is consistent with the similarity of common protein peaks ().
Figure 1. (a) Comparison of MALDI-TOF MS representative spectra of randomly selected nine Staphylococci (b) Close examination of protein peaks common to these nine Staphylococci (c) Similarity graph to standard strain S. aureus ATCC 25923 THL (SA-18) according to CCI values of all protein profiles of seventeen other Staphylococci defined by MALDI-TOF MS.
Figura 1. (a) Comparación de los espectros representativos de la EM MALDI-TOF de nueve estafilococos seleccionados aleatoriamente; (b) examen minucioso de los picos de proteínas comunes a los nueve estafilococos; (c) gráfico de similitud con la cepa estándar S. aureus ATCC 25923 THL (SA-18), según los valores de CCI de todos los perfiles de proteínas de otros 17 estafilococos definidos por EM MALDI-TOF
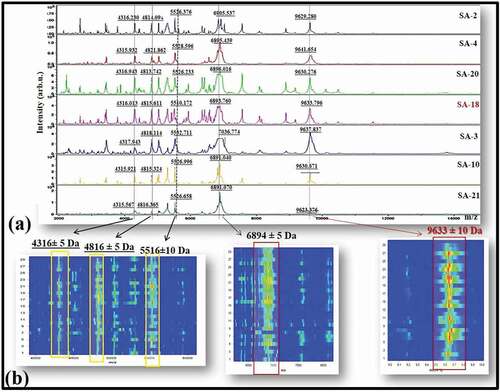
Gel profile showing the distribution of protein peaks of twenty-seven isolates identified as S. aureus by MALDI-TOF MS () and spectra of randomly selected six S. aureus were compared to that of the SA-18 (). Macroscopic examination revealed both common and differential peaks in the spectra of different strains. The SA-18 protein peaks (m/z; 4316 Da, 4816 Da, 5516 Da, 6894 Da, and 9633 Da) appeared to be consistent with the spectra of all S. aureus (). It is clearly seen in the gel image of all S. aureus that the projections of these protein peaks are compatible ().
Figure 2. (a) Representative whole-cell MALDI-TOF MS spectra of randomly selected six S. aureus and the standard strain S. aureus ATCC 25923 THL (SA-18). X and Y axes represent m/z and intensity, respectively. (b) Spectral gel images of twenty-seven S. aureus and SA-18 show continuous projection of all biomarker proteins (m/z; 4316, 4816, 5526, 6895 and 9636). X and Y axes represent m/z and spectra of S. aureus, respectively.
Figura 2. (a) Espectros de EM MALDI-TOF representativos de células enteras de seis S. aureus seleccionados aleatoriamente y de la cepa estándar S. aureus ATCC 25923 THL (SA-18). Los ejes X e Y representan m/z e intensidad, respectivamente; (b) imágenes espectrales de gel de 27 S. aureus y SA-18 muestran la proyección continua de todas las proteínas biomarcadoras (m/z; 4316, 4816, 5526, 6895 y 9636). Los ejes X e Y representan m/z y espectros de S. aureus, respectivamente
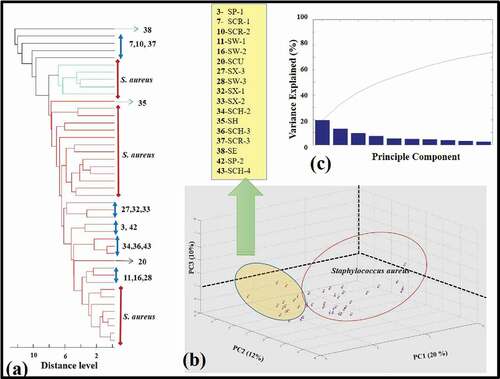
The dendrogram profile and 3D scatter profile and variance evaluation of forty-four Staphylococci isolates with SA-18 standard strain were performed (). In the scatter profile, S. aureus were located close to each other and in the same cluster (), whereas a similar situation was not observed in the dendrogram profile (). The highest variance value for all strains was determined as 20% ().
Figure 3. (a) The dendrogram profile and (b) 3D scatter profile of all forty-four Staphylococci with the standard strain S. aureus ATCC 25923 THL (SA-18). The spot represents one spectrum, and the plots were generated by PCA. List of other Staphylococci matched with dendrogram numbers. (c) The explanation of variance of all forty-four Staphylococci.
Figura 3. (a) Perfil del dendrograma; y (b) perfil de dispersión 3D de los 44 estafilococos de la cepa estándar S. aureus ATCC 25923 THL (SA-18). El punto representa un espectro y los gráficos se generaron mediante PCA. La lista de otros estafilococos coincide con los números del dendrograma; (c) explicación de la varianza de los 44 estafilococos
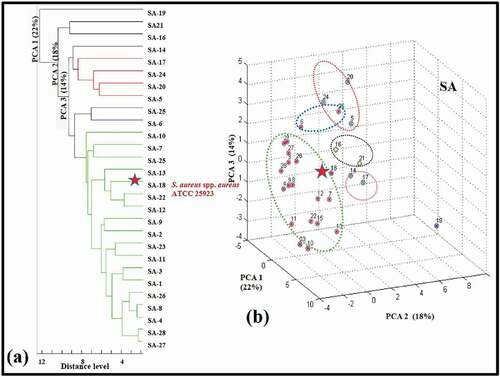
In addition, the dendrogram profile generated from the spectra of each S. aureus isolate, the PCA scattering plot is given in . In relation to SA-18 used as an internal standard with these isolates, its placement in the cluster appears to be highly compatible with S. aureus isolates. In the 3D scatter plot, the presence of small clusters formed by matching point spectra as well as large clusters draw attention. When the CCI relationships were evaluated, for example, it was found that the isolates SA-16 and SA-21 were similar to each other by 78% (CCI%) and the isolates SA-6 and SA-25 by 84% (CCI%) ().
Figure 4. Biotyper analysis of twenty-seven S. aureus and standard strain S. aureus ATCC 25923 THL (SA-18). (a) The first three variance values on their dendrogram profile. (b) Their 3D scatter profile. The spot represents one spectrum, and the plots were generated by PCA.
Figura 4. Análisis de biotipos de 27 S. aureus y de la cepa estándar S. aureus ATCC 25923 THL (SA-18). (a) res primeros valores de varianza en su perfil de dendrograma. (b) Su perfil de dispersión en 3D. El punto representa un espectro y los gráficos se generaron mediante PCA
As a result, the similarity of 81.5% of S. aureus strains to SA-18 was determined above 50% of CCI. The average of the five-point masses representing different peaks (m/z; 4316 Da, 4816 Da, 5516 Da, 6894 Da, and 9633 Da) of SA-18 and S. aureus strains (including SA-18) was revealed with the gel profile of 28 spectra by the MATLAB program.
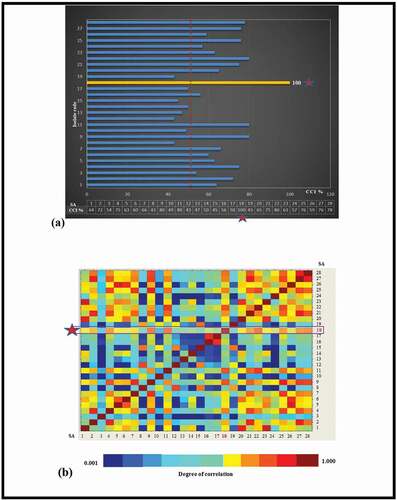
In , both the comparison graph and the color matrix of twenty-seven S. aureus and the CCI values according to SA-18 were presented. The color scale ranges from dark blue (dissimilarity) to red (highest similarity). As shown in , only five of the twenty-seven S. aureus identified with MALDI-TOF MS appeared to have less than 50% similarity to SA-18. However, it was also seen in the CCI color matrix that isolates had also similarities (red boxes) and dissimilarities (blue boxes) to each other ().
Figure 5. (a) CCI values of the twenty-seven S. aureus according to the standard strain of S. aureus ATCC 25923 (SA-18). (b) The degree of similarity between pair mass spectra comparisons ranging from red (very similar) to blue (very dissimilar).
Figura 5. (a) Valores de CCI de los 27 S. aureus según la cepa estándar de S. aureus ATCC 25923 (SA-18); (b) grado de similitud entre las comparaciones de los espectros de masas de los pares, que van del rojo (muy similar) al azul (muy diferente)
A limited number of studies have been reported that have used MALDI-TOF MS for foodborne microbial typing (Murray, Citation2010). For this reason, and because similar work is scarce internationally as well, our results are discussed in relation to findings of both dairy foods-based studies and studies with other bacteria by MALDI-TOF MS analysis. The results of current study were almost in compliance with the results of a previous study (Pérez-Sancho et al., Citation2018) in determining five different mass peaks in all S. aureus strains as m/z; 4316 Da, 4816 Da, 5510 Da, 6894 Da, and 9636 Da in this study, and m/z; 3430, 6861, 4046, 6890, and 8093 in Pérez-Sancho’s study in which they evaluated the suitability of MALDI-TOF MS for rapid identification of both subspecies using a panel of fifty-two S. aureus isolates (30 subsp. anaerobius and 22 subsp. aureus) recovered from different origins, countries, and years. They correctly identified forty-two of fifty-two (81%) S. aureus isolates at the species level with score values >2.0 whereas 54.5% of S. aureus isolates at the species level with score values >2.0 by MALDI-TOF MS, and twenty-seven Staphylococcus aureus isolates among a total of forty-four Staphylococci recovered from raw milk and traditional artisanal dairy foods in Central Anatolia and the Mediterranean Regions of Turkey, using MALDI-TOF MS-based PCA in this study. Barreiro et al. (Citation2017) also correctly identified bovine mastitis-causing bacteria (S. aureus, Streptococcus uberis, Strep. agalactiae, Strep. dysgalactiae, and Escherichia coli) directly from contaminated milk samples with the score values ≥2.0 by MALDI-TOF MS.
This study provides a proof of concept that the MS profiling generated by MALDI-TOF MS could be used to quickly identify S. aureus isolates from raw milk and other dairy food matrix. In this study, MALDI-TOF MS technique confirmed higher scores for Staphylococcus spp. isolates within 2 minutes which also indicated its advantage including less time, economical, and >99% more sensitive in comparison to conventional identification methods (Manukumar & Umesha, Citation2017). The results of the current study (93.1% of the isolates were identified as Staphylococcus spp.) were similar to the studies using MALDI-TOF MS as a confirmation tool for the identification of Staphylococci species from dairy foods. In this sense, Tonamo et al. (Citation2021) identified forty-two (60.9%) of sixty-nine isolates on genus and species level and successfully identified twenty-eight of the forty-two isolates from raw milk, bulk tank milk, and cheese samples as Staphylococcus spp. by MALDI-TOF MS analysis. They also showed that these twenty-eight staphylococcal isolates formed two clusters, one consisting of twenty-two S. aureus strains and the other composed of six non-aureus Staphylococci, including S. simulans, S. auricularis, S. equorum, and S. haemolyticus. On the other hand, Mahmmod et al. (Citation2018) reported a higher typeability percentage (78%) based on five hundred and eleven non-aureus Staphylococci isolates, originating from bovine quarter milk and teat surface samples, using MALDI-TOF MS. Böhme et al. (Citation2012) used this technique for the identification and classification of thirty-six S. aureus isolates isolated from Italian dairy products by their spectral fingerprints and found the peak masses m/z; 3444, 5031, and 6887 to be specific biomarkers for S. aureus in all of the isolates. Castro et al. (Citation2020) identified successfully the staphylococcal isolates from artisanal Minas cheeses in Brazil by MALDI-TOF MS. Horváth et al. (Citation2020) showed MALDI-TOF MS as a suitable for rapid and cost-effective identification of S. aureus among foodborne coagulase-positive Staphylococcus species in routine diagnostics. Braga et al. (Citation2018) identified S. aureus, S. chromogenes, S. epidermidis, and S. xylosus by MALDI TOF MS analysis of isolates detected from cows with subclinical mastitis, in order to broadly identify mastitis-causing pathogens. In addition, whole-cell MALDI-TOF MS has been demonstrated as a useful tool for rapid identification and classification of not only for Staphylococci, but also for a variety species of microorganisms both from dairy foods and other food groups (Murray, Citation2010). Dušková et al. (Citation2012) showed higher success rates of species-level identification (93%) using the MALDI-TOF MS approach than PCR assay (77%) with regard to the identification of Lactobacillus species from dairy and meat products. As another example, Dubois et al. (Citation2010) showed that MALDI TOF MS profiling correlated best with 16S rRNA, but not with sodA sequence. Tirpanci Sivri and Oksuz (Citation2019) identified the isolates from traditional artisanal Mihalic cheeses in Turkey as Propionibacterium freudenreichii ssp. freudenreichii (57%), Propionibacterium freudenreichii ssp. shermanii (33%), and Propionibacterium thoeni (10%) by MALDI-TOF MS. Elbehiry et al. (Citation2017), p. 100% correctly identified S. aureus, Campylobacter jejuni, E. coli, Salmonella enterica, Acinetobacter baumannii, Enterobacter cloacae, and Klebsiella pneumonia by MALDI-TOF MS fingerprinting with a score value ≥2.00, among sixty-six foodborne bacterial isolates from food products of different restaurants in Al-Qassim region.
However, an improvement by the addition of a proteomic-based approach to the MALDI-TOF MS may improve the discriminatory power of this method and hence increase its efficiency by making it possible to identify bacteria at the strain or serotype level (Rychert, Citation2019).
To the best of our knowledge, this is the first study that has evaluated the applicability of MALDI-TOF MS for identification of Staphylococcus spp. in raw milk, and traditional artisanal dairy foods in a comprehensive approach in Turkey, and also is the first time that a detailed spectral comparison was carried out and characteristic peak masses were determined for foodborne Staphylococci and S. aureus in Turkey. Therefore, this study also shows that the manufacturing of artisanal dairy foods requires an improvement of the hygienic conditions to reduce the risk of S. aureus dissemination in the community and a control strategy needs to be developed to prevent and control the harmful effects of S. aureus on public health in an aspect of Turkey.
4. Conclusion and future aspects
Although in recent years MALDI-TOF MS has been integrated into the workflow of food microbiology laboratories for microbial identification by replacing the traditional biochemical or molecular technique, its use in food samples is still in its early stages, as its database is mostly for microorganisms isolated from the clinical samples. Moreover, as there is a need for the identification of microbial diversity in a complex food matrix, it is thought that more foodborne species will be identified on time with the optimization of the MALDI-TOF MS database soon, together with the increasing resolving powers and sensitivity of MS devices on biomolecules. Hence, MALDI-TOF MS can be used not only for well‐accepted MALDI‐TOF MS‐based fingerprint matches but also for areas such as, targeted MS identification and typing of foodborne bacteria, bacterial toxins identification, and antibiotics resistance and susceptibility tests. Therefore, further development and expansion of the MALDI-TOF MS reference database is needed for the identification of less common, obscure species or emerging pathogens where data may not be available in its library, by adding MSPs of well-characterized strains. Since the accuracy of MALDI-TOF MS is entirely dependent upon the comprehensiveness of the reference database used to match protein profiles, this would allow gaining important insight into the foodborne relevance of these foodborne species. A locally developed reference database may also help for an efficient MALDI-TOF MS analysis of region-specific bacterial strains with geographic variations. In addition, MALDI-TOF MS could be a promising rapid, inexpensive, and precise tool for the identification of high amounts of presumptive microorganisms in food analysis, which is considered a necessary factor for food safety and quality, especially during outbreaks of food poisoning.
Author contributions
B.M.T. devised the study, the main conceptual ideas, methodology and investigation. B.M.T. isolated the presumptive strains and performed the most of the technical details in whole analysis. Y.N.C worked out in MALDI-TOF MS-based PCA. All authors provided critical feedback and helped shape the manuscript by drafting the manuscript. B.M.T. revised and approved its final version. All authors have read and agreed to the published version of the manuscript.
Geolocation information
This study was done in Ankara which is located at Turkey country in the cities place category with the GPS coordinates of 39° 55ʹ 31.9188” N and 32° 51ʹ 58.6332” E.
Data availability
The authors confirm that the data supporting the findings of this study are available within the article.
Disclosure statement
No potential conflict of interest was reported by the author(s).
Additional information
Funding
References
- Ahmed, A. A.-H., Maharik, N. M. S., Valero, A., & Kamal, S. M. (2019). Incidence of enterotoxigenic Staphylococcus aureus in milk and Egyptian artisanal dairy products. Food Control, 104, 20–27. https://doi.org/https://doi.org/10.1016/j.foodcont.2019.04.017
- Balaban, N., & Rasooly, A. (2000). Staphylococcal enterotoxins. International Journal of Food Microbiology, 61(1), 1–10. https://doi.org/https://doi.org/10.1016/S0168-1605(00)00377-9
- Barreiro, J. R., Gonçalves, J. L., Campos Braga, P. A., Dibbern, A. G., Eberlin, M. N., & Veiga dos Santos, M. (2017). Non-culture-based identification of mastitis-causing bacteria by MALDI-TOF mass spectrometry. Journal of Dairy Science, 100(4), 2928–2934. https://doi.org/https://doi.org/10.3168/jds.2016-11741
- Bittar, F., Ouchenane, Z., Smati, F., Raoult, D., & Rolain, J.-M. (2009). MALDI-TOF MS for rapid detection of staphylococcal Panton–Valentine leucocidin. International Journal of Antimicrobial Agents, 34(5), 467–470. https://doi.org/https://doi.org/10.1016/j.ijantimicag.2009.03.017
- Böhme, K., Morandi, S., Cremonesi, P., Fernández No, I. C., Barros‐Velázquez, J., Castiglioni, B., Brasca, M., Cañas, B., & Calo-Mata, P. (2012). Characterization of Staphylococcus aureus strains isolated from Italian dairy products by MALDI‐TOF mass fingerprinting. Electrophoresis, 33(15), 2355–2364. https://doi.org/https://doi.org/10.1002/elps.201100480
- Braga, P. A. C., Gonçalves, J. L., Barreiro, J. R., Ferreira, C. R., Tomazi, T., Eberlin, M. N., & Santos, M. V. (2018). Rapid identification of bovine mastitis pathogens by MALDI-TOF mass spectrometry. Pesquisa Veterinária Brasileira, 38(4), 586–594. https://doi.org/https://doi.org/10.1590/1678-5150-pvb-4821
- Cameron, M., Barkema, H. W., De Buck, J., De Vliegher, S., Chaffer, M., Lewis, J., & Keefe, G. P. (2017). Identification of bovine-associated coagulase-negative staphylococci by matrix-assisted laser desorption/ionization time-of-flight mass spectrometry using a direct transfer protocol. Journal of Dairy Science, 100(3), 2137–2147. https://doi.org/https://doi.org/10.3168/jds.2016-12020
- Castro, R. D., Pedroso, S. H. S. P., Sandes, S. H. C., Silva, G. O., Luiz, K. C. M., Dias, R. S., Filho, R. A. T., Figueiredo, H. C. P., Santos, S. G., Nunes, A. C., & Souza, M. R. (2020). Virulence factors and antimicrobial resistance of Staphylococcus aureus isolated from the production process of Minas artisanal cheese from the region of Campo das Vertentes, Brazil. Journal of Dairy Science, 103(3), 2098–2110. https://doi.org/https://doi.org/10.3168/jds.2019-17138
- Cheng, K., Chui, H., Domish, L., Hernandez, D., & Wang, G. (2016). Recent development of mass spectrometry and proteomics applications in identification and typing of bacteria. Proteomics Clinical Applications, 10(4), 346–357. https://doi.org/https://doi.org/10.1002/prca.201500086
- Chye, F. Y., Abdullah, A., & Ayob, M. K. (2004). Bacteriological quality and safety of raw milk in Malaysia. Food Microbiology, 21(5), 535–541. https://doi.org/https://doi.org/10.1016/j.fm.2003.11.007
- Clark, A. E., Kaleta, E. J., Arora, A., & Wolk, D. M. (2013). Matrix-assisted laser desorption ionization–time of flight mass spectrometry: A fundamental shift in the routine practice of clinical microbiology. ClinicalMicrobiology Reviews, 26(3), 547–603. https://doi.org/https://doi.org/10.1128/CMR.00072-12
- Cortimiglia, C., Bianchini, V., Franco, A., Caprioli, A., Battisti, A., Colombo, L., Stradiotto, K., Vezzoli, F., & Luini, M. (2015). Prevalence of Staphylococcus aureus and methicillin-resistant S. aureus in bulk tank milk from dairy goat farms in Northern Italy. Journal of Dairy Science, 98(4), 2307–2311. https://doi.org/https://doi.org/10.3168/jds.2014-8923
- Dingle, T. C., & Butler-Wu, S. M. (2013). MALDI-TOF mass spectrometry for microorganism identification. Clinics in Laboratory Medicine, 33 (3), 589–609. PMID: 23931840. https://doi.org/https://doi.org/10.1016/j.cll.2013.03.001
- Dubois, D., Leyssene, D., Chacornac, J. P., Kostrzewa, M., Schmit, P. O., Talon, R., Bonnet, R., & Delmas, J. (2010). Identification of a variety of Staphylococcus species by matrix-assisted laser desorption ionization-time of flight mass spectrometry. Journal of Clinical Microbiology, 48(3), 941–945. https://doi.org/https://doi.org/10.1128/JCM.00413-09
- Dušková, M., Šedo, O., Kšicová, K., Zdráhal, Z., & Karpíšková, R. (2012). Identification of lactobacilli isolated from food by genotypic methods and MALDI-TOF MS. International Journal of Food Microbiology, 159(2), 107–114. https://doi.org/https://doi.org/10.1016/j.ijfoodmicro.2012.07.029
- Elbehiry, A., Marzouk, E., Hamada, M., Al-Dubaib, M., Alyamani, E., Moussa, I. M., AlRowaidhan, A., & Hemeg, H. A. (2017). Application of MALDI-TOF MS fingerprinting as a quick tool for identification and clustering of foodborne pathogens isolated from food products. New Microbiologica, 40 (4), 269–278. PMID: 28825446. https://pubmed.ncbi.nlm.nih.gov/28825446/
- Erik, I., Kilic, G., Ozturk, E., Karaoglu, S. A., & Yayli, N. (2020). Chemical composition, antimicrobial, and lipase enzyme activity of essential oil and solvent extracts from Serapias orientalis subsp. orientalis. Turkish Journal of Chemistry, 44(6), 1655–1662. https://doi.org/https://doi.org/10.3906/kim-2005-51
- Fagerquist, C. K., Garbus, B. R., Williams, K. E., Bates, A. H., Boyle, S., & Harden, L. A. (2009). Web-based software for rapid top-down proteomic identification of protein biomarkers, with implications for bacterial identification. Applied and Environmental Microbiology, 75(13), 4341–4353. https://doi.org/https://doi.org/10.1128/AEM.00079-09
- Fagundes, H., Barchesi, L., Filho, A. N., Ferreira, L. M., & Oliveira, C. A. (2010). Occurrence of Staphylococcus aureus in raw milk produced in dairy farms in São Paulo state, Brazil. Brazilian Journal of Microbiology, 41(2), 376–380. https://doi.org/https://doi.org/10.1590/S1517-83822010000200018
- Gonzales-Barron, U., Gonçalves-Tenório, A., Rodrigues, V., & Cadavez, V. (2017). Foodborne pathogens in raw milk and cheese of sheep and goat origin: A meta-analysis approach. Current Opinion in Food Science, 18, 7–13. https://doi.org/https://doi.org/10.1016/j.cofs.2017.10.002
- Hennekinne, J.-A., De Buyser, M.-L., & Dragacci, S. (2012). Staphylococcus aureus and its food poisoning toxins: Characterization and outbreak investigation. FEMS Microbiology Reviews, 36(4), 815–836. https://doi.org/https://doi.org/10.1111/j.1574-6976.2011.00311.x
- Horváth, B., Peles, F., Szél, A., Sipos, R., Erős, Á., Albert, E., & Micsinai, A. (2020). Molecular typing of foodborne coagulase-positive Staphylococcus isolates identified by MALDI-TOF MS. Acta Alimentaria, 49(3), 307–313. https://doi.org/https://doi.org/10.1556/066.2020.49.3.9
- Hu, S. K., Liu, S. Y., Hu, W. F., Zheng, T. L., & Xu, J. G. (2013). Molecular biological characteristics of Staphylococcus aureus isolated from food. European Food Research and Technology, 236(2), 285–291. https://doi.org/https://doi.org/10.1007/s00217-012-1887-4
- Jahan, M., Rahman, M., Parvej, M. S., Chowdhury, S. M. Z. H., Haque, M. E., Talukder, M. A. K., & Ahmed, S. (2015). Isolation and characterization of Staphylococcus aureus from raw cow milk in Bangladesh. Journal of Advanced Veterinary and Animal Research, 2(1), 49–55. https://doi.org/https://doi.org/10.5455/javar.2015.b47
- Jamali, H., Paydar, M., Radmehr, B., Ismail, S., & Dadrasnia, A. (2015). Prevalence and antimicrobial resistance of Staphylococcus aureus isolated from raw milk and dairy products. Food Control, 54(383–388), 383–388. https://doi.org/https://doi.org/10.1016/j.foodcont.2015.02.013
- Jeong, Y.-S., Lee, J., & Kim, S.-J. (2013). Discrimination of Bacillus anthracis spores by direct in-situ analysis of matrix-assisted laser desorption/ionization time-of-flight mass spectrometry. Bulletin of the Korean Chemical Society, 34(9), 2635–2639. https://doi.org/https://doi.org/10.5012/bkcs.2013.34.9.2635
- Johler, S., Macori, G., Bellio, A., Acutis, P. L., Gallina, S., & Decastelli, L. (2018). Characterization of Staphylococcus aureus isolated along the raw milk cheese production process in artisan dairies in Italy. Journal of Dairy Science, 101(4), 2915–2920. https://doi.org/https://doi.org/10.3168/jds.2017-13815
- Khater, D. F., Lela, R. A., El-Diasty, M., Moustafa, S. A., & Wareth, G. (2021). Detection of harmful foodborne pathogens in food samples at the points of sale by MALDI-TOF MS in Egypt. BMC Research Notes, 14(112). https://doi.org/https://doi.org/10.1186/s13104-021-05533-8
- Kim, E., Cho, E.-J., Yang, S.-M., Kim, M.-J., & Kim, H.-Y. (2021). Novel approaches for the identification of microbial communities in kimchi: MALDI-TOF MS analysis and high-throughput sequencing. Food Microbiology, 94, 103641. https://doi.org/https://doi.org/10.1016/j.fm.2020.103641
- Kim, J.-M., Kim, I., Chung, S. H., Chung, Y., Han, M., & Kim, J.-S. (2019). Rapid discrimination of methicillin-resistant Staphylococcus aureus by MALDI-TOF MS. Pathogens, 8(4), 214. https://doi.org/https://doi.org/10.3390/pathogens8040214
- Kooken, J., Fox, K., Fox, A., Altomare, D., Creek, K., Wunschel, D., Pajares-Merino, S., Martínez-Ballesteros, I., Garaizar, J., Oyarzabal, O., & Samadpour, M. (2014). Identification of staphylococcal species based on variations in protein sequences (mass spectrometry) and DNA sequence (sodA microarray). Molecular and Cellular Probes, 28(1), 41–50. https://doi.org/https://doi.org/10.1016/j.mcp.2013.10.003
- Mahmmod, Y. S., Nonnemann, B., Svennesen, L., Pedersen, K., & Klaas, I. C. (2018). Typeability of MALDI-TOF assay for identification of non-aureus staphylococci associated with bovine intramammary infections and teat apex colonization. Journal of Dairy Science, 101(10), 9430–9438. https://doi.org/https://doi.org/10.3168/jds.2018-14579
- Manukumar, H. M., & Umesha, S. (2017). MALDI-TOF MS-based identification and molecular characterization of food associated methicillin-resistant Staphylococcus aureus. Scientific Reports, 7(1), 11414. https://doi.org/https://doi.org/10.1038/s41598-017-11597-z
- Murray, P. R. (2010). Matrix-assisted laser desorption ionization time-of-flight mass spectrometry: Usefulness for taxonomy and epidemiology. Clinical Microbiology and Infection, 16(11), 1626–1630. https://doi.org/https://doi.org/10.1111/j.1469-0691.2010.03364.x
- Pazakova, J., Turek, P., & Laciakova, A. (1997). The survival of Staphylococcus aureus during the fermentation and storage of yoghurt. Journal of Applied Microbiology, 82 (5), 659–662. PMID: 9172410. https://doi.org/https://doi.org/10.1111/j.1365-2672.1997.tb02877.x
- Pérez-Sancho, M., Vela, A. I., Horcajo, P., Ugarte-Ruiz, M., Domínguez, L., Fernández-Garayzábal, J. F., & de la Fuente, R. (2018). Rapid differentiation of Staphylococcus aureus subspecies based on MALDI-TOF MS profiles. Journal of Veterinary Diagnostic Investigation, 30(6), 813–820. https://doi.org/https://doi.org/10.1177/1040638718805537
- Peruzy, M. F., Murru, N., Yu, Z., Cnockaert, M., Joossens, M., Proroga, Y. T. R., & Houf, K. (2019). Determination of the microbiological contamination in minced pork by culture dependent and 16S amplicon sequencing analysis. International Journal of Food Microbiology, 290, 27–35. https://doi.org/https://doi.org/10.1016/j.ijfoodmicro.2018.09.025
- Rahimi, E. (2013). Enterotoxigenicity of Staphylococcus aureus isolated from traditional and commercial dairy products marketed in Iran. Brazilian Journal of Microbiology, 44(2), 393–399. https://doi.org/https://doi.org/10.1590/S1517-83822013000200008
- Riva, A., Borghi, E., Cirasola, D., Colmegna, S., Borgo, F., Amato, E., Pontello, M. M., & Morace, G. (2015). Methicillin-resistant Staphylococcus aureus in raw milk: Prevalence, SCCmec typing, enterotoxin characterization, and antimicrobial resistance patterns. Journal of Food Protection, 78(6), 1142–1146. https://doi.org/https://doi.org/10.4315/0362-028X.JFP-14-531
- Rychert, J. (2019). Benefits and limitations of MALDI-TOF mass spectrometry for the identification of microorganisms. Journal of Infectiology, 2(4), 1–5. https://doi.org/https://doi.org/10.29245/2689-9981/2019/4.1142
- Samad, R. A., Al Disi, Z., Ashfaq, M. Y. M., Wahib, S. M., & Zouari, N. (2020). The use of principle component analysis and MALDI-TOF MS for the differentiation of mineral forming Virgibacillus and Bacillus species isolated from sabkhas and Bacillus species isolated from sabkhas. RSC Advances, 10, 14606–14616. https://doi.org/https://doi.org/10.1039/D0RA01229G
- Sauget, M., Valot, B., Bertrand, X., & Hocquet, D. (2017). Can MALDI-TOF mass spectrometry reasonably type bacteria? Trends in Microbiology, 25(6), 447–455. https://doi.org/https://doi.org/10.1016/j.tim.2016.12.006
- Schmidt, T., Kock, M. M., & Ehlers, M. M. (2018). Identification and characterization of Staphylococcus devriesei isolates from bovine intramammary infections in KwaZulu-Natal, South Africa. BMC Veterinary Research, 14(1), 324. https://doi.org/https://doi.org/10.1186/s12917-018-1655-1
- Tirpanci Sivri, G., & Oksuz, O. (2019). Identification of Propionibacterium spp. isolated from Mihalic cheeses by MALDI-TOF MS. Tekirdag Ziraat Fakültesi Dergisi, 16(2), 244–250. https://doi.org/https://doi.org/10.33462/jotaf.526431
- Tonamo, A., Komlósi, I., Varga, L., Kačániová, M., & Peles, F. (2021). Identification of ovine-associated staphylococci by MALDI-TOF mass spectrometry, Acta Alimentaria, 50(2), 210–218. Retrieved May 2, 2021, from https://akjournals.com/view/journals/066/aop/article-10.1556-066.2020.00246/article-10.1556-066.2020.00246.xml
- Tong, S. Y. C., Davis, J. S., Eichenberger, E., Holland, T. L., & Fowler, V. G., Jr. (2015). Staphylococcus aureus infections: Epidemiology, pathophysiology, clinical manifestations, and management. Clinical Microbiology Reviews, 28(3), 603–661. https://doi.org/https://doi.org/10.1128/CMR.00134-14
- Trülzsch, K., Grabein, B., Schumann, P., Mellmann, A., Antonenka, U., Heesemann, J., & Becker, K. (2007). Staphylococcus pettenkoferi sp. nov., a novel coagulase-negative staphylococcal species isolated from human clinical specimens. International Journal of Systematic and Evolutionary Microbiology, 57(7), 1543–1548. https://doi.org/https://doi.org/10.1099/ijs.0.64381-0
- van Veen, S. Q., Claas, E. C., & Kuijper, E. J. (2010). High-throughput identification of bacteria and yeast by matrix-assisted laser desorption ionization-time of flight mass spectrometry in conventional medical microbiology laboratories. Journal of Clinical Microbiology, 48(3), 900–907. https://doi.org/https://doi.org/10.1128/JCM.02071-09
- Wanecka, A., Król, J., Twardoń, J., Mrowiec, J., Korzeniowska-Kowal, A., & Wzorek, A. (2019). Efficacy of MALDI-TOF mass spectrometry as well as genotypic and phenotypic methods in identification of staphylococci other than Staphylococcus aureus isolated from intramammary infections in dairy cows in Poland. Journal of Veterinary Diagnostic Investigation, 31(4), 523–530. https://doi.org/https://doi.org/10.1177/1040638719845423
- Wang, Y. R., Chen, Q., Cui, S. H., & Li, F. Q. (2013). Characterization of Staphylococcus aureus isolated from clinical specimens by matrix assisted laser desorption/ionization time-of-flight mass spectrometry. Biomedical and Environmental Sciences, 26(6), 430–436. https://doi.org/https://doi.org/10.3967/0895-3988.2013.06.003
- Wilson, I. G., Heany, J. C. N., & Weatherup, S. T. C. (1997). The effect of ice cream scoop water on the hygiene of ice-cream. Epidemiology & Infection, 119(1), 35–40. https://doi.org/https://doi.org/10.1017/s0950268897007668
- Zhu, W., Sieradzki, K., Albrecht, V., McAllister, S., Lin, W., Stuchlik, O., Limbago, B., Pohl, J., & Rasheed, J. K. (2015). Evaluation of the Biotyper MALDI-TOF MS system for identification of Staphylococcus species. Journal of Microbiological Methods, 117, 14–17. https://doi.org/https://doi.org/10.1016/j.mimet.2015.07.014
- Zúñiga Estrada, A., Sánchez Mendoza, M., Mota de la Garza, L., & Ortigoza Ferado, J. (1999). Behavior of enterotoxigenic strains of Staphylococcus aureus in milk fermented with a yogurt starter culture. Revista Latinoamericana de Microbiologia, 41 (1), 5–10. PMID: 10932746. https://pubmed.ncbi.nlm.nih.gov/10932746/