
ABSTRACT
Ion mobility spectrometry coupled to gas-chromatographic (GC-IMS) is tested regarding their ability to analyze various refined edible vegetable oils, including sunflower seed, rapeseed, sesame, soybean, peanut, corn, camellia, linseed, walnut, coconut, grape seed and extra virgin olive oils. GC-IMS assay displays peak difference of each edible vegetable oil in three-dimensional information at retention time in gas phase and at ion mobility rate in IMS. Moreover, 74 main peak intensities are extracted and imported into Excel for analysis. Then, chemometric methods are employed to establish discriminant models. The results show that based on Kennards-Stone (KS), the prediction accuracy of the soft independent modeling of class analogy (SIMCA) is perfect. Therefore, the GC-IMS system is shown to be an effective method to classification of edible vegetable oils.
1. Introduction
Vegetable oils are one of the important commodities in the international market, which are compounds composed of unsaturated fatty acids and glycerol. Vegetable oils are extracted from fruits, seeds and germs of plants. There are many kinds of edible vegetable oils. At the same time, the processing technologies are diverse and the production areas are vast. These differences result in great differences in fatty acid composition, flavor characteristics, nutrient content and commercial value of edible vegetable oils. Therefore, it is essential to investigate the authenticity and classification of edible vegetable oils. The studies on rapid, lower-cost and nondestructive methods for composition/adulterants are becoming essential for food safety and public health (Hong et al., Citation2005; Majchrzak et al., Citation2017).
Many detection methods have been already presented in literature about the determination of edible vegetable oil. Edible oils have been analyzed using Raman spectroscopy, which demonstrates the application in studies of discrimination and thermal stability assessment of edible vegetable oils (Alvarenga et al., Citation2018; Berghian-Grosan & Magdas, Citation2020; Kwofie et al., Citation2020; Zhou et al., Citation2012). Near Infrared (NIR) technology has been used for quantitative analysis of corn oil in edible blend oil (Zhang et al., Citation2022), to evaluate olive oil quality (Mailer, Citation2004) and to study sunflower oil is adulterated with mineral oil (Picouet et al., Citation2018). Ion mobility spectrometry (IMS) has been applied for detecting the adulterated sesame oils (Zhang et al., Citation2016). Some researchers have combined fluorescence spectroscopy with chemometrics methods to characterize edible oils (Botosoa et al., Citation2021; Cao et al., Citation2017; Xu et al., Citation2016). Nuclear Magnetic Resonance (NMR) spectroscopy coupled with multivariate statistical analysis has been used for distinguishing plant origin of edible oils (Zhang et al., Citation2018). Normal-phase liquid chromatography in conjugation with chemometric strategies has been used to differentiate olive oil from other edible vegetable oils (Jiménez-Carvelo et al., Citation2017). Matrix-assisted laser desorption/ionization mass spectrometry (MALDI-MS) has been used for analysis of edible oils, and good classification was obtained with the help of partial least square-discriminant analysis (Ng et al., Citation2018). Despite the fact that these methods have many advantages, they are time consuming, require sample manipulation and lack selectivity (Sikorska et al., Citation2005).
GC-IMS is simple, rapid and sensitive. The GC has outstanding separation characteristics, and the IMS has advantages of fast response and high sensitivity. Their combination can effectively solve the low discrimination ability of GC, and the problem of cross sensitivity exists when mixtures are detected with IMS. Finally, three-dimensional spectra of retention time drift time and signal intensity are obtained to make qualitative analysis more accurate.
Recently, GC-IMS has been successfully applied in many fields (Guo et al., Citation2022; Li et al., Citation2022; Wang et al., Citation2021), such as food flavor analysis and quality detection. In 2015, for assigning the quality of virgin olive oil, Garrido-Delgado et al. (Citation2015) used GC-IMS to determinate volatile compounds. As a result, a total of 26 volatile metabolites were identified. Headspace-Gas-Chromatography Ion-Mobility Spectrometry (HS-GC-IMS) combined with optimized chemometric techniques has proved to be a good choice for assessing the authenticity of the botanical origins of honey (Gerhardt et al., Citation2018). Citrus reticulata “Chachi” have been rapid discriminated by headspace-gas chromatography-ion mobility spectrometry (Lv et al., Citation2020). GC-IMS technique was explored in the analysis of flavor formation during production of Dezhou braised chicken (Yao et al., Citation2022).
Aroma is an important quality criterion for edible vegetable oils. The volatile organic compounds (VOCs) are important markers for edible oils. In this study, the purpose is to develop a rapid, low-cost and low-sample demanding method able to assess edible vegetable oils. To achieve this purpose, applying GC-IMS combined with chemometric data elaboration as the analytical method to classify 12 kinds of oil samples. Sample set partitioning based on KS, 224 samples are separated as calibration data set and then the rest (96 samples) all belong to validation data set. Then, the SIMCA is employed to model for oil discriminant analysis.
2. Experimental
2.1. Samples
A total of 320 vegetable oil samples of 12 commercially available edible oils are analyzed. In this study, 33 corn oil samples, 35 peanut oil samples, 15 camellia oil samples, 18 extra virgin olive oil samples, 32 sesame oil samples, 35 sunflower seed oil samples, 32 linseed oil samples, 12 coconut oil samples, 28 rapeseed oil samples, 24 walnut oil samples and 9 grape seed oil samples are acquired in supermarkets and have expiry dates exceeding the maximum duration of the experiments. The soybean oil samples are offered by Sinograin Zhenjiang Grains & Oils Quality Testing Center Co., Ltd.
2.2. GC-IMS analysis parameter
The analyses are performed on a GC-IMS instrument (Flavourspec®-G.A.S.Dortmund Company -Germany). The system is equipped with a syringe and an autosampler unit for headspace analysis. As shown in , 2 ml of oil sample is transferred into a 20-mL headspace vial that is closed with magnetic caps. After 10 min of incubation at 90°C (T3), a headspace volume of 0.2 ml is sampled at a speed of 20 ml/min and a syringe temperature of 95°C to avoid condensation effects.
Figure 1. Headspace injection experiment process of GC-IMS.
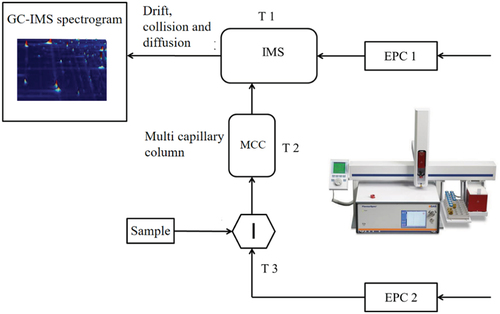
The chromatographic separation is equipped with a SE-54-CB-1 (5%phenyl-1%vinyl-94% methylpolysiloxane) capillary column (15 m × 0.53 mm, 1 μm film thickness). Nitrogen of 99.99% purity is used as a carrier/drift gas. T2 (chromatographic column temperature) kept at 40°C and T1 (drift tube temperature) kept at 45°C. The chromatographic separation is carried out at constant temperature, employing a carrier gas flow ramp (EPC2) starting at 2 ml/min for 10 min and then increasing to 15 ml/min within 20 min. The total GC runtime is 30 min. The drifting flow ramp (EPC1) is set as 150 ml/min.
3. Results and discussion
The study of specific volatile compounds so as to identify them is created using the LAV software from G.A.S. (version 2.0.0. Dortmund, Germany). The data obtained represents a 3D graph in which each point is characterized by the retention time in seconds (on the y axis), the drift time in milliseconds (on the x axis) and the intensity of ion current signal in millivolts (on the z axis). The GC-IMS map of 12 kinds of oil samples are shown in (three-dimensional GC-IMS spectrum projected on pseudo color map of two-dimensional plane). The contrast color in the figure represents the signal intensity of the components in the process of ion migration. when the deeper the color and the greater the area in the map, it means that the more content of a certain substance in the measured substance.
Figure 2. 2D GC-IMS chromatogram from the analysis.
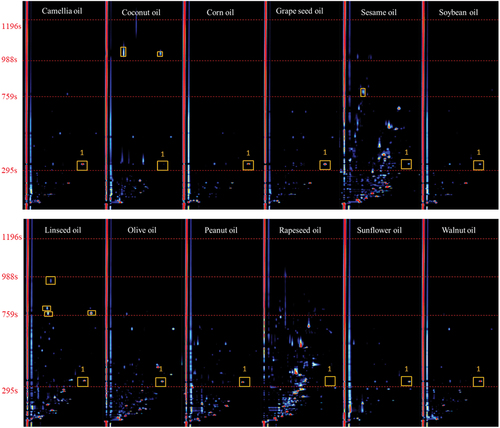
As shown in , rapeseed oil contains many kinds of components. Soybean oil is the simplest. Only two components are detected in coconut oil formula during the retention period of 988s−1196s. Within the retention period of 759s−988s, there is one component in sesame oil and four components in linseed oil. During the retention period of 441s−588s, there are many kinds of components in rapeseed oil and sesame oil. Except coconut oil and rapeseed oil, the rest oil samples contain No. 1 volatile component. Meanwhile, the content of this component in each sample is different. It can be clearly seen from the figure that each kind of edible vegetable oil has its own characteristic peak information of volatile components under same experiment conditions.
shows a summary of the 74 ion mobility peaks of 12 types of edible oil samples at the same GC retention time and ion mobility time using the instrument’s LAV analysis software. Peak intensity of total samples for each edible oil is given in . As shown in , the GC retention time is divided into five time periods. The number of peaks of the 12 oil samples in these five time periods is counted. Comparing the arrangement of different characteristic peaks in , it can be found that the same kind of vegetable oil contains common VOCs. So, the characteristic peaks are similar similarity. For different types of edible oil, there are significant differences in the peak intensity at the same peak position in . Each kind of vegetable oil has the characteristics of VOCs which belong to this vegetable oil. These VOCs have fingerprint characteristics of signals with GC retention time and IMS drift time. It is possible to establish a database of ion mobility spectral fingerprint characteristics of various vegetable oil VOCs. By comparing the fingerprint characteristics of these VOCs, the types of vegetable oil are distinguished. Therefore, the shared VOCs fingerprint characteristics of each type of vegetable oil can be found in different kinds of vegetable oils. These characteristics can be used to classify edible oil.
Figure 3. Peak intensities of the 12 kinds of edible oils.
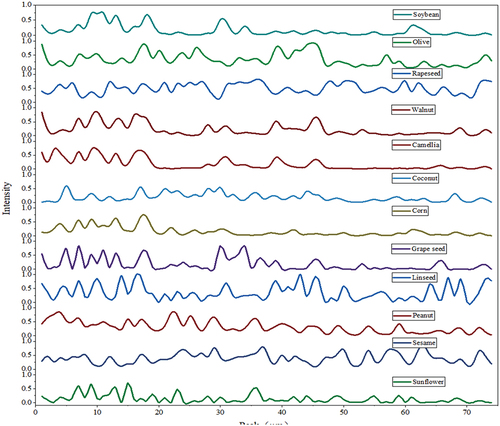
Figure 4. 74 peak intensities. (a) 47 soybean oil samples; (b) 18 olive oil samples; (c) 28 rapeseed oil samples; (d) 24 walnut oil samples; (e) 15 camellia oil samples; (f) 12 coconut oil samples; (g) 33 corn oil samples; (h) 9 grape seed oil samples; (i) 32 linseed oil samples; (j) 35 peanut oil samples; (k) 32 sesame oil samples; (l) 35 sunflower oil samples.
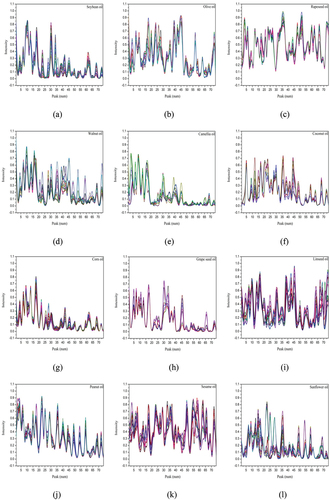
Table 1. The number of peaks of the 12 edible oils in 5 different retention time periods.
The normalization and principal component analysis (PCA) calculation are performed in Matlab R2018. PCA is used to show the sample clustering. The score plot in shows that 74 GC-IMS characteristic maps of rapeseed, sesame, olive, coconut and peanut oils are far from the other edible oils respectively, as displayed on the 1st and 2nd principal components (PCs). Moreover, although the other 7 edible oils show some separation, they are still heavily overlapped.
Figure 5. (a) PCA score plot of PC1 and PC2. (b) calibration set and validation set: 1 soybean; 2 olive; 3 rapeseed; 4 walnut; 5 camellia; 6 coconut; 7 corn; 8 grape seed; 9 linseed; 10 peanut; 11 sesame; 12 sunflower.
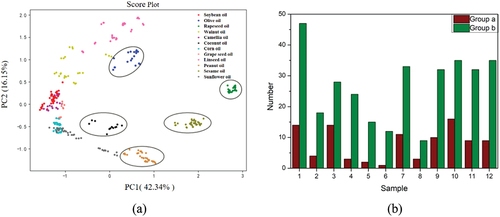
All samples are regarded as candidate samples of calibration set in KS method, and samples from them are selected to calibration set in turn (Zhan et al., Citation2009). Firstly, two vector pairs with the farthest Euclidean distance are selected to enter the calibration set. In the next iteration, the samples with the largest and smallest distance are selected to enter the calibration set. In the same way, the required numbers of samples are acquired. The advantage of this method is to ensure that the samples in the calibration set are evenly distributed according to the space distance. In this study, oil samples are divided into 70% calibration set and 30% validation set according to KS. As shown in , Group A is calibration set and group B is validation set. The figures in the figure represent the sample categories.
SIMCA is a supervised pattern recognition approach based on principal component analysis (PCA). The basic idea includes two steps: the first step is to establish each type of PCA regression model; the second step is to fit each type of model one by one with unknown samples, then according to the fitting results to classify them. In this work, the out of class test method is used to calculate the F test statistics of each sample. If the statistic is less than the corresponding F test threshold value of a category, it is determined to belong to that category. If the F test statistics are greater than or less than all the critical test values, the category corresponding to the minimum F test statistics is taken as the final category.
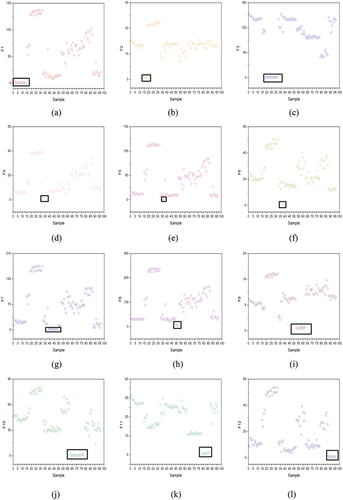
The SIMCA identification analysis maps of 12 kinds of edible oil are shown in . The significant level in the SIMCA model is 0.01. In order to verify the prediction effect of SIMCA qualitative model, the established qualitative analysis model is used to predict and analyze the spectra of 96 samples in the validation set. It can be seen from that the recognition accuracy is 100%. The core of SIMCA algorithm is PCA which is based on linear transformation. However, it constructs principal component regression model for the spectrogram of each kind of samples for classification. So, it has more definite feature discrimination ability (Satyam & Shashikant, Citation2017; Smidt et al., Citation2008).
Figure 6. Classification of edible oils using SIMCA. (a) soybean; (b) olive; (c) rapeseed; (d) walnut; (e) camellia; (f) coconut; (g) corn; (h) grape seed; (i) linseed; (j) peanut; (k) sesame; (l) sunflower.
4. Conclusions
GC-IMS can be used to analyze the quality of edible vegetable oils without any sample pretreatment (non-destructive). Classification analysis is done by extracting GC-IMS fingerprint features of samples. In this study, nearly perfect classification rates are obtained for each partition of the dataset, denoting the high power of GC-IMS to characterize food samples. It has important theoretical value to study the fingerprint based on GC-IMS technology for the quality detection of edible vegetable oil. By virtue of its high sensitivity, ease of operation, ruggedness and fastness, GC-IMS might become the technique of choice to solve the problems of identification or adulteration of edible vegetable oils.
Disclosure statement
No potential conflict of interest was reported by the authors.
Additional information
Funding
References
- Alvarenga, B. R., Xavier, F. A. N., Soares, F. L. F., & Carneiro, R. L. (2018). Thermal stability assessment of vegetable oils by raman spectroscopy and chemometrics. Food Analytical Methods, 11(7), 1969–1976. https://doi.org/10.1007/s12161-018-1160-y
- Berghian-Grosan, C., & Magdas, D. A. (2020). Raman spectroscopy and machine-learning for edible oils evaluation. Talanta, 218, 121176. https://doi.org/10.1016/j.talanta.2020.121176
- Botosoa, E. P., Chene, C., & Karoui, R. (2021). Front face fluorescence spectroscopy combined with pls-da allows to monitor chemical changes of edible vegetable oils during storage at 60 at 60°C. European Journal of Lipid Science and Technology, 123(6). https://doi.org/10.1002/ejlt.202000088
- Cao, J., Li, C., Liu, R., Liu, X. R., Fan, Y. W., & Deng, Z. Y. (2017). Combined application of fluorescence spectroscopy and chemometrics analysis in oxidative deterioration of edible oils. Food Analytical Methods, 10(3), 649–658. https://doi.org/10.1007/s12161-016-0587-2
- Garrido Delgado, R., Dobao-Prieto, M. M., Arce, L., & Valcárcel, M. (2015). Determination of volatile compounds by GC-IMS to assign the quality of virgin olive oil. Food Chemistry, 187, 572–579. https://doi.org/10.1016/j.foodchem.2015.04.082
- Gerhardt, N., Birkenmeier, M., Schwolow, S., Rohn, S., & Weller, P. (2018). Volatile-compound fingerprinting by headspace-gas-chromatography ion-mobility spectrometry (HS-GC-IMS) as a benchtop alternative to 1H NMR profiling for assessment of the authenticity of honey. Analytical Chemistry, 90(3), 1777–1785. https://doi.org/10.1021/acs.analchem.7b03748
- Guo, S., Zhao, X., Ma, Y., Wang, Y., & Wang, D. (2022). Fingerprints and changes analysis of volatile compounds in fresh-cut yam during yellowing process by using HS-GC-IMS. Food Chemistry, 369, 130939. https://doi.org/10.1016/j.foodchem.2021.130939
- Hong, Y., Irudayaraj, J., & Paradkar, M. M. (2005). Discriminant analysis of edible oils and fats by FTIR, FT-NIR and FT-Raman spectroscopy. Food Chemistry, 93(1), 25–32. https://doi.org/10.1016/j.foodchem.2004.08.039
- Jiménez-Carvelo, A. M., Pérez-Castaño, E., González-Casado, A., & Cuadros Rodríguez, L. (2017). One input-class and two input-class classifications for differentiating olive oil from other edible vegetable oils by use of the normal-phase liquid chromatography fingerprint of the methyl-transesterified fraction. Food Chemistry, 221, 1784–1791. https://doi.org/10.1016/j.foodchem.2016.10.103
- Kwofie, F., Lavine, B. K., Ottaway, J., & Booksh, K. (2020). Differentiation of edible oils by type using raman spectroscopy and pattern recognition methods. Applied Spectroscopy, 74(6), 645–654. https://doi.org/10.1177/0003702819888220
- Li, X. R., Dong, Y. F., Jiang, P. F., Qi, L. B., & Lin, S. Y. (2022). Identification of changes in volatile compounds in sea cucumber apostichopus japonicus during seasonings soaking using HS-GC-IMS. LWT - Food Science & Technology, 154, 154. https://doi.org/10.1016/j.lwt.2021.112695
- Lv, W. S., Lin, T., Ren, Z. Y., Jiang, Y. Q., Zhang, J., Bi, F., Gu, L. H., Hou, H. C., & He, J. (2020). Rapid discrimination of citrus reticulata ‘Chachi’ by headspace-gas chromatography-ion mobility spectrometry fingerprints combined with principal component analysis. Food Research International, 131, 108985. https://doi.org/10.1016/j.foodres.2020.108985
- Mailer, R. J. (2004). Rapid evaluation of olive oil quality by NIR reflectance spectroscopy. Journal of the American Oil Chemists’ Society, 81(9), 823–827. https://doi.org/10.1007/s11746-004-0986-4
- Majchrzak, T., Wojnowski, W., Dymerski, T., Gębicki, J., & Namiesnik, J. (2017). Electronic noses in classification and quality control of edible oils: A review. Food Chemistry, 246, 192–201. https://doi.org/10.1016/j.foodchem.2017.11.013
- Ng, T. T., Li, S. Y., Ng, C. C. A., So, P. K., Wong, T. F., Li, Z. Y., Chan, S. T., & Yao, Z. P. (2018). Establishment of a spectral database for classification of edible oils using matrix-assisted laser desorption/ionization mass spectrometry. Food Chemistry, 252, 335–342. https://doi.org/10.1016/j.foodchem.2018.01.125
- Picouet, P. A., Gou, P., Hyypiö, R., & Castellari, M. (2018). Implementation of NIR technology for at-line rapid detection of sunflower oil adulterated with mineral oil. Journal of Food Engineering, 230, 18–27. https://doi.org/10.1016/j.jfoodeng.2018.01.011
- Satyam, S., & Shashikant, S. (2017). Data processing approaches and strategies for non-destructive fruits quality inspection and authentication: A review. Journal of Food Measurement and Characterization, 12(4), 2758–2794. https://doi.org/10.1007/s11694-018-9893-2
- Sikorska, E., Górecki, T., Khmelinskii, I. V., Sikorski, M., & Kozioł, J. (2005). Classification of edible oils using synchronous scanning fluorescence spectroscopy. Food Chemistry, 89(2), 217–225. https://doi.org/10.1016/j.foodchem.2004.02.028
- Smidt, E., Meissl, K., Schwanninger, M., & Lechner, P. (2008). Classification of waste materials using Fourier transform infrared spectroscopy and soft independent modeling of class analogy. Waste Management, 28(10), 1699–1710. https://doi.org/10.1016/j.wasman.2007.08.003
- Wang, Z. L., Yuan, Y. X., Hong, B., Zhao, X., & Gu, Z. Y. (2021). Characteristic volatile fingerprints of four chrysanthemum teas determined by HS-GC-IMS. Molecules, 26(23), 7113. https://doi.org/10.3390/molecules26237113
- Xu, J., Liu, X. F., & Wang, Y. T. (2016). A detection method of vegetable oils in edible blended oil based on three-dimensional fluorescence spectroscopy technique. Food Chemistry, 212, 72–77. https://doi.org/10.1016/j.foodchem.2016.05.158
- Yao, W., Cai, Y., Liu, D., Chen, Y., Li, J., Zhang, M., Chen, N., & Zhang, H. (2022). Analysis of flavor formation during production of dezhou braised chicken using headspace-gas chromatography-ion mobility spectrometry (HS-GC-IMS). Food Chemistry, 370, 130989. https://doi.org/10.1016/j.foodchem.2021.130989
- Zhan, X. R., Zhu, X. R., Shi, X. Y., Zhang, Z. Y., & Qiao, Y. J. (2009). Determination of hesperidin in tangerine leaf by near-infrared spectroscopy with SPXY algorithm for sample subset partitioning and monte carlo cross validation. Spectroscopy and Spectral Analysis, 29, 964–968. https://doi.org/10.3964/j.issn.1000-0593(2009)04-0964-05
- Zhang, H., Hu, X. Y., Liu, L. M., Wei, J. F., & Bian, X. H. (2022). Near infrared spectroscopy combined with chemometrics for quantitative analysis of corn oil in edible blend oil. Spectrochimica acta Part A Molecular and biomolecular spectroscopy, 270, 270. https://doi.org/10.1016/j.saa.2021.120841
- Zhang, L. X., Shuai, Q., Li, P. W., Zhang, Q., Ma, F., Zhang, W., & Ding, X. X. (2016). Ion mobility spectrometry fingerprints: A rapid detection technology for adulteration of sesame oil. Food Chemistry, 192, 60–66. https://doi.org/10.1016/j.foodchem.2015.06.096
- Zhang, Y., Zhao, Y. R., Shen, G. P., Zhong, S., & Feng, J. H. (2018). NMR spectroscopy in conjugation with multivariate statistical analysis for distinguishing plant origin of edible oils. Journal of Food Composition and Analysis, 69, 140–148. https://doi.org/10.1016/j.jfca.2018.03.006
- Zhou, X. J., Dai, L. K., & Li, S. (2012). Fast discrimination of edible vegetable oil based on Raman spectroscopy. Spectroscopy and Spectral Analysis, 32(7), 1829–1833. https://doi.org/10.3964/j.issn.1000-0593(2012)07-1829-05