
ABSTRACT
Register data are described, in general and specific terms, by focusing on informational content from an educational science perspective. Arguments are provided on the ways in which educational scientists can benefit from register data. It is concluded that register data contain a great deal of information relevant to educational science. Furthermore, two specific features of register data are considered: their panel data nature, implying that register data analyses under certain conditions can account for aspects on which the registers are not informative, and the intergenerational links that these data contain that facilitate the separation of genetic and environmental influences on learning. It is observed that while register data do not contain direct links between students and teachers, this shortcoming can be overcome by merging register data with survey data on these links. As population data, register data enable analyses that are not feasible to conduct with survey data. An illustration is provided concerning how quantitative and qualitative researchers can benefit from combining register-based statistical analyses with in-depth case studies. The use of register data in evaluations of the causal effects of educational interventions is also described. To exploit these advantages, a discussion on how to access register data is included.
Introduction
Register data are fundamentally a Nordic phenomenon. Similar data, concerning information about a country’s entire population in many different aspects, are not available elsewhere.Footnote1 With respect to research, register data provide the Nordic countries with a formidable advantage compared with the rest of the world. Although register data have been used extensively for quite some time in medical science, epidemiology, and many social sciences, such as sociology, economics, and political science, their potential has thus far been insufficiently exploited in educational science, i.e. educational research related to pedagogics and didactics. In part, this may be due to less emphasis on quantitative skills in the PhD programme in educational science; knowledge of quantitative methods facilitates the use of register data. Presumably, there remains a lack of information regarding how empirical educational scientists may benefit from using register data (Vetenskapsrådet, Citation2015).
A discussion of the research training that is offered to graduate students in educational science is beyond the scope of this article. Instead, my aim is to address the second explanation, i.e. to reduce the informational problem by discussing, from an educational science perspective, five advantages of register data compared with survey and interview data.
The first advantage is that register data are very rich and detailed, both across individuals and organisations and over time, and have broad coverage. In addition to data on education and training, they contain information on related outcome variables, such as labour market experiences and health.
The second advantage is that register data enable powerful combinations of quantitatively and qualitatively oriented research. Specifically, register-based quantitative analyses can guide the selection of subsequent informative qualitative studies.
The third advantage derives from the fact that some empirical research problems call for many observations on specific pieces of information that apply to specific groups of individuals. These requirements can be very expensive or impossible to satisfy with survey data but can be easily fulfilled with register data.
The fourth advantage is that by combining register data with survey data, it is possible to construct datasets with properties that cannot be achieved by the compilation of either a survey or register dataset alone.
The fifth advantage is that register data under certain conditions enable large-scale evaluations of the causal effects of educational policy interventions.
Given these advantages of register data, the next sections consider the typical features of register data and different approaches to the use of register data from an educational science perspective.
Typical features of register data
The most salient feature of register data is that they are population data, defined and measured at very low levels of aggregation. Specifically, the data concern individuals, residences, workplaces (e.g. schools), and small geographical units. For example, there are register data regarding all individuals who reside in a Nordic country and are enrolled in upper secondary school.
That register data are population data is, by itself, a huge advantage because it means that register data can be matched with an arbitrary other dataset without any observations in the other dataset being lost. This scenario is quite different from that when, for example, two survey datasets are being matched; in this case, the resulting matched dataset will only contain (complete) information for the intersection of the two original datasets.
Two very useful properties of register data are that they constitute panel data and contain intergenerational links. The panel data structure means that there are repeated observations of individuals and organisations. The presence of intergenerational links implies that, inter alia, a student’s parents and siblings can be identified.
A common property of most types of register data is that they typically have been compiled not to support research but for administrative purposes, such as tax collection, society planning (e.g. for education), censuses, and health documentation. Consequently, register data are seldom ideally structured from a researcher’s point of view. However, in most cases this is not a significant problem; good and inexpensive software packages exist that can efficiently handle many types of datasets.
There are exceptions to the rule that register datasets have been compiled for non-research purposes. One example is the Swedish Twin Register, which covers Swedish twins born in 1886 and onwards and contains data on more than 200,000 individuals.Footnote2
Another related characteristic of register data is that they seldom extend very far back in time because many administrative tasks did not become effectively computerised until the late 1980s. However, historical register data are becoming available to a steadily increasing extent. Data that were previously only available on paper, in files and binders, are being transferred to electronic media, which enables analyses of long time periods. One example of a register database with lengthy historical records is the Swedish Child Welfare Intervention Register, which dates back to 1968.Footnote3
Ways to use register data
Essentially, there are three different ways to use register data:
As they come
In this case, typically, information from many different registers is combined.
To enrich already collected data
In general, the already collected data are some type of survey data. For example, a researcher may have collected data on teachers and students who have been involved in a pedagogical support programme. To evaluate the effects of the support programme, the survey data need to be complemented with background data and data on comparable teachers and students who have not been affected by the programme. The matching of the survey data with the register data requires unique identifiers for the teachers, students, and schools covered by the survey data.
In connection with a data collection to be conducted
The aim of this use of register data is to reduce the respondents’ ‘informational burden’ by asking them only about facts and data that cannot be obtained from other sources. For instance, in a study of student attitudes, the students do not need to be asked about their family backgrounds in terms of their parents’ educations, occupations, and earnings because information on these variables is readily available in register databases. This use of register data has the advantage of not only making surveys shorter and thus cheaper but also reducing non-response rates and accordingly increasing the precision of the conclusions that can be drawn from the collected information.
Register data of interest – and information that is lacking
One way to describe the possibilities and limits of register data is to use different types of data classifications (taxonomies), showing categories/classes for which there are and for which there are not register data, respectively. This is the main approach pursued here. However, to complement this display of register data availability with information concerning the interfaces between different types of data, two simple schematic figures are also provided.
Following Cedefop (Citation2014),Footnote4 we start by considering the following three broad categories of education and learning:
Formal education and learning
Learning that occurs in an organised and structured environment (such as in an educational or training institution or on the job) and is explicitly designated as learning (in terms of objectives, time, or resources). Formal learning is intentional from the learner’s point of view and typically leads to certification.
Non-formal education and learning
Learning that is embedded in planned activities that are not explicitly designated as learning (in terms of learning objectives, learning time, or learning support) but contain an important learning element. Non-formal learning is intentional from the learner’s point of view but typically does not lead to certification.
Informal learning
Learning that results from daily activities that relate to work, family, or leisure. It is not organised or structured in terms of objectives, time, or learning support. Informal learning is in most cases unintentional from the learner’s perspective and is also referred to as experiential or incidental/random learning.
Of these three categories, only formal education is represented in the register data of Nordic countries. However, information on non-formal education and training is collected in two large surveys, the Adult Education Survey (AES)Footnote5 and the Programme for International Assessment of Adult Competencies (PIAAC),Footnote6 and both surveys can be matched with register data.
Another useful taxonomy relates to ‘observational units’ as defined in register data. At the lowest levels of aggregation, the observational units of interest in the present context are individuals, and education and training sites.
With respect to individuals, the relevant categories here are students/learners, teachers/instructors, managers/leaders, and support staff (). The types of data listed in the table are not meant to be exhaustive; they merely provide examples of the data that could be of interest to empirical educational science studies.
Table 1. Types of register data, by category of individuals, in the Nordic countries.
The frequencies at which data are recorded differ across the various types of information that are displayed in . Some pieces of information are recorded only once, such as country of birth and biological parents, whereas other pieces of information are updated daily, such as the data on unemployment and sickness benefits. Between these extremes, there are yearly data, e.g. concerning education and place of residence, and quarterly data, e.g. concerning employment and earnings.
The registers do not contain more qualitatively oriented information, such as attitudes and ambitions. However, this limitation does not necessarily mean that such aspects cannot be accounted for. Because register data comprise repeated observations of the same individuals, i.e. panel data, aspects such as attitudes and ambitions can be controlled for, as long as these aspects are constant over the time period under study. For example, consider individual skills. In addition to education and training, skills can depend on attitudes towards schooling and learning ambitions.Footnote7 If the individuals’ education and training change during the study period but their attitudes and ambitions remain fixed, the impacts of education and training on skills, controlling for attitudes and ambitions, can be estimated by relating the changes in skills to the changes in education and training. Thus, there is no need for explicit measures of variables such as attitudes and ambitions when these variables do not vary, which implies that the corresponding changes are zero (Hsiao, Citation1986). But, of course, in some cases, changing students’ attitudes and ambitions may be (part of) the objectives of an educational reform. In such cases, the register data must be complemented by survey data on these aspects.
Another type of relevant information that is not covered by register data concerns school and teaching support programmes that are local or regional in nature. At the local government level, and even in individual schools, it is quite common to find small-scale initiatives to improve teaching methods or to try alternative methods of organisation, such as teamwork approaches. These efforts are not recorded in register data (although they are often locally documented). Even quite large and extensive teaching support schemes can go unnoticed in register data if they have been initiated outside the nationally financed system of education and training. Below, we consider an example of such a scheme, namely, the Swedish Natural sciences and Technology for All (NTA) programme.
Concerning workplaces, the natural entities are various types of ‘learning sites’. In the context of formal education and training, these sites are preschools, schools, colleges and universities, and training facilities for skills, such as labour market training and immigrant language courses. For non-formal and informal training, learning sites can occasionally be identified. On-the-job training is a case in point, where the site can be the individual’s workplace. In other cases, information regarding the learning site may be lacking, for instance, in the case of study circles and self-study.
The register data on learning sites contain information on students, staff, and expenditure. Regarding students, there are data on applications, enrolment, examinations, grades, programmes, and fields of study. The information on staff includes employment by categories, qualifications, and part-time/full-time positions. Expenditure is provided in terms of wages and salaries, rents, and material outlays. As a rule, the information is recorded annually.
shows that information involving the different categories of individuals in can be connected to information concerning education and training sites. For example, it is possible to extract information on the students and various categories of staff for a given university, and students and teachers/school leaders/support staff can be linked to the education or training institution where they are active. However, there are no horizontal links in the figure, from one category of individuals to another. This means that the different categories of individuals can only be indirectly connected, through education and training facilities. In particular, students and learners cannot be directly connected with teachers and instructors. Accordingly, register data do not indicate which teachers have taught which students/learners. For educational science purposes, this limitation is the main drawback of register data. Innumerable studies have concluded that teachers are the most important determinant of students’ learning outcomes (e.g. Gustafsson, Citation2003; Hattie, Citation2009). Moreover, as shown by Hattie (Citation2009), the characteristics that are recorded in register data, such as teacher training, qualifications regarding the subject taught, and work experience, have low significance, whereas the properties that are not recorded, such as teaching methods, expectations about students’ skills, and the ability to create positive relationships with students, are very important. Without direct measures, the easiest way to account for these factors is to control for which teacher(s) the students have had. Thus, if combining survey data and register data is an option, presumably the most valuable survey data that can be collected is information regarding which students the teachers have taught.
Figure 1. Links that can be established between observational units in register data.
describes the intergenerational links that are available in register data. Although only illustrates the links between two consecutive generations, register data can contain links among three or even four generations.
Figure 2. Intergenerational links in register data.
The importance of the intergenerational links is that they make it possible to account for different aspects of ‘nature and nurture’. An obvious example is the well-recognised importance of parental characteristics in studies regarding, say, children’s learning behaviour. Another example: to evaluate the influences of various types or amounts of schooling, one can study the differences between siblings who have been brought up together but who have not had the same educational experience, thereby controlling for the home environment and genetic factors.Footnote8 An alternative approach to eliminating genetic factors is to study adoptees or foster children.
How to access register information
The first thing to note about register data is that, in general, they are available for research purposes only. To verify that the data are going to be used in a research project, a request for a register dataset must be accompanied by a research plan that contains research question(s) and a description of the data and methods that are required to answer them.
Given the research plan, the researcher must initially decide whether the project needs to undergo a review by an ethics committee. The purpose of the review is to weigh the expected social benefits and knowledge gains that are generated by the project against the risks and costs that are associated with violations of personal integrity.
For projects that employ register data only, an ethics review may not be necessary. However, if the project’s data involve health information, an ethics review is always required. This requirement derives from the fact that in medicine, in contrast to the social sciences, all research projects must be approved by an ethics committee before they can be initiated (Ludvigsson et al., Citation2015). Concerning ethical considerations, the same rules that apply to medicine should apply to the social sciences; in other words, an ethical review is required if the data include health information (irrespective of whether this information has been extracted from register databases or has been obtained through other means).
When the project dataset is constructed from register data and survey data, an ethics review is almost always required because of the requirement for informed consent that arises in connection with survey data. The review is to ascertain that the people who are targeted by the survey are appropriately informed about: (i) the research project, in terms of its aims, methods, data, and publication of results; (ii) why and how they have been selected to participate in the survey; (iii) the project’s handling of data and the presentation of the results to secure personal integrity; (iv) participation being voluntary; and (v) how to accept or decline participation in the project.Footnote9
A distinction is made between active and passive informed consent. Active consent means that the prospective participant explicitly, in writing, accepts or declines participation. Conversely, passive consent means that unless the person explicitly (in writing) declines participation, she or he implicitly agrees to participate. In deciding between active and passive consent, the ethics committee considers, inter alia, that if the study involves a very large number of individuals active consent may be infeasible and may sharply reduce response rates and, thus, the precision of the project’s results.
If the survey is to be conducted as part of the project, it may appear that by responding to the survey, the person agrees to participate in the project; otherwise, she or he declines participation. However, the important aspect here is that the survey data are combined with register data (see the discussion above under the heading Ways to use register data). If part of the information concerning the participants is obtained from register data, informed consent regarding the register data part of the data collection is necessary. Informed consent is also necessary if the project uses a survey that has been conducted earlier, prior to the project, and complements the survey data with register data. Accordingly, survey information and register data cannot simply be merged; the researcher has to plan ahead, inform the respondents concerning the intention to combine the two types of data, and obtain their consent.
In addition to being prompted by the issue of informed consent, an ethics review can be required for other reasons. Examples that are relevant in the educational science context are projects that concern children and/or involve video recordings.Footnote10
When the project has been approved by an ethics committee (when an ethics review is required), the next step is to approach the organisation(s) that administers the data of interest. In general, this step involves contacting the national statistical agency;Footnote11 however, it can also involve other agencies. For example, health-related data are, for the most part, not administered by the national statistical agencies.Footnote12
Before providing researchers with access to the requested dataset, the data-administering organisation(s) makes an assessment concerning the harm that the project could potentially cause informants if their personal integrity were to be violated in terms of, for example, costs, (bad) reputation, and the disclosure of organisational or personal confidential information. Personal integrity cannot be violated by the disclosure of specific pieces of individual information because the data are pseudonymised before they are released to researchers. Pseudonymised means that the unique personal and workplace identifiers have been replaced by serial numbers; the information that is needed to recover the original identifiers – the key – is kept by the national statistical agency. However, in rich datasets, it may still be possible to locate specific individuals through backward identification, i.e. by combining many pieces of detailed information.Footnote13
The assessments that are made by the data-administering organisations are based on laws and regulations that differ somewhat from the laws that underlie the ethical reviews. Accordingly, the fact that a project’s dataset has been considered acceptable by an ethics committee does not guarantee that the project will be approved by the agencies that supply the data. As a rule, the decision made by a data-administering organisation is similar to the decision of an ethics committee, but the decision of a data-administering organisation is occasionally more cautious than the decision of an ethics committee and, thus, somewhat more restrictive.Footnote14 Part of the register information may be provided in a more aggregated form than originally requested to make backward identification more difficult. For instance, individuals’ country of birth can be replaced by a territory involving several countries.
Sometimes it may be possible to extract the data from register databases that have been constructed by research institutes. Two examples in the Nordic countries are the Danish National Centre for Social Research (SFI) and the Institute for Evaluation of Labour Market and Education Policy (IFAU) in Sweden. When feasible, data access through these institutions is cheaper and faster than through the national statistical agencies. However, in general, the underlying research project must (partly) involve researchers who are employed at these institutions. Alternatively, in the case of the IFAU, the project does not need to include any IFAU researchers if it is supported by an IFAU research grant; these grants can also be applied for by researchers in other Nordic countries. However, considering the discussion under the heading Ways to use register data, the use of the data that are obtained through this channel is limited to the ‘as they come’ option because the data are pseudonymised.
To ascertain the safe handling of the data and prevent them from being accessed by unauthorised people, the researchers are usually granted remote access only.Footnote15 Thus, the data never physically leave the data-administering organisation, and access to them is safeguarded through a log-on procedure that requires the user to provide a specific password. Moreover, there are time limits on accessibility. After a prespecified period, the remote access channel will be closed, and the key will be destroyed unless the terms of the original agreement are renegotiated.
Finally, the discussion above addresses access to intranational register data only. It is not unlikely that register data for all of the Nordic countries will become available in the near future. A successful first attempt to create a database that contains the register data for Denmark, Finland, Norway, and Sweden has already been conducted. The core of the database comprises data from the PIAAC survey to which register data for 2011 have been added. The added data include geographical information, labour market data, and the take-up of social welfare benefits. For information on how this database can be accessed, see Rosdahl (Citation2015).
Combining quantitative and qualitative research
In educational science, as in many other disciplines, quantitative and qualitative methods are seldom combined. It seems, however, that empirical educational science research can benefit from merging qualitative and quantitative approaches.Footnote16 This will be illustrated by means of a fictional example.
Assume that female students are believed to be underrepresented in upper secondary school science tracks. Moreover, assume that the female representation may be increased by appropriate teaching methods and student counselling. How can we test these conjectures? The characteristic research strategies of a qualitatively and a quantitatively oriented researcher might be described as follows.
To confirm that female students are underrepresented, the qualitative researcher might check a yearbook of educational statistics, which shows that females comprise less than 50% of science students. Next, the researcher might ask the teachers’ union for examples of upper secondary schools that have been successful in attracting females to science tracks. Among the schools suggested, two are chosen. Both schools are within commuting distance, but one school is located in a poor neighbourhood and the other school is located in a wealthy neighbourhood. At each school, 15 randomly selected female science students are interviewed on why they chose a science track. The girls’ science teachers and study counsellors in the last year of compulsory school (identified by the girls) are also interviewed.
The interviews provide information concerning teaching methods and counselling advice that appear to increase the girls’ interest in science and make them choose science tracks, in two quite different socio-economic contexts. However, two objections may be raised. First, the measure that is used of underrepresentation is rather simplistic. Secondly, the girls interviewed may be a selective group. Specifically, they may have characteristics, i.e. upbringing, interests, ambitions, and study skills, such that they would have chosen science tracks in upper secondary school irrespective of which compulsory school they happened to attend. If so, the science teachers and study counsellors that they met may not be representative of teachers and counsellors that are successful in making girls choose science tracks.
In contrast to the qualitatively oriented researcher, the quantitative researcher begins by compiling register data, for all students who attended the last year in compulsory school, on gender, family background, school, scholastic achievements (grades and results on national tests), and choice of track in upper secondary school. A regression analysis is then used to model the choice between science tracks and other tracks.Footnote17 The analysis provides a measure of girls’ underrepresentation in science tracks that is reasonable in the sense that it controls for parental background and scholastic achievements.Footnote18 Moreover, the analysis yields information on which compulsory schools increase or decrease the likelihood of girls choosing a science track.Footnote19 The problem with the analysis is that it cannot say anything about why the choice is made.Footnote20
However, the two approaches can be combined. Specifically, the results of a quantitative analysis can be used to determine which schools to study more closely, by qualitative methods. These should be the schools that in the quantitative analysis have been found to matter – positively or negatively – to girls’ choice of science tracks. The qualitative analysis of these schools can provide answers regarding why they matter.
This combined use of quantitative and qualitative methods presupposes that the quantitative analysis precedes the qualitative analysis. This feature is not specific to this example but holds in general. The idea is to employ the quantitative analysis as an instrument to select the case studies that are most likely to provide insights regarding the mechanisms that underlie the patterns that are observed in the quantitative data.
An example of research requiring register data
There are quite a few research problems that can be credibly examined only through register data, simply because other sources cannot provide sufficient numbers of observations. The example that is considered here concerns school starting age.
From an international perspective, children in the Nordic region start school quite late. The (normal) starting age used to be 7 years in Denmark, Finland, Norway, and Sweden.Footnote21 This prompts the question: is it better to start school earlier? Using Swedish register data, Fredriksson and Öckert (Citation2006, Citation2014) provide an answer to this question.Footnote22
Across the 1975–1983 birth cohorts, the actual school starting age in Sweden varied between approximately 5.8 and 8.6 years ().
Figure 3. School starting age and grade point average (GPA) at the end of compulsory school in Sweden, for the 1975–1983 birth cohorts. Ninth grade GPA is in percentile ranks. Source: Fredriksson and Öckert (Citation2006).
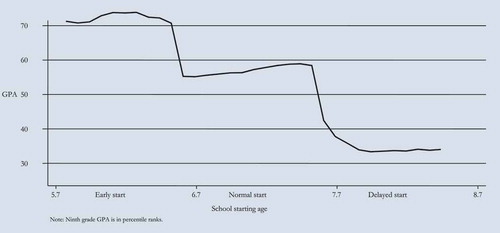
In , the relation between school starting age and grade point average (GPA), is negative; children who start school earlier have higher GPAs than children who start school later. Initially, this relation appears to indicate that it is better to start school earlier. However, the school starting age is clearly not random; ‘bright’ kids tend to be overrepresented among the children who start early, whereas less talented children tend to be delayed. Moreover, it is important to separate the differences in age from the differences in school starting age. Specifically, one would like to compare children who differ as little as possible concerning chronological age but who differ regarding school starting age. In principle, this comparison is possible because children who were born at the end of year t will start school in the year t + 7, while children born at the very beginning of year t + 1 will start school one year later. In practice, however, such a comparison is very difficult to conduct if the data can only be collected by means of surveys; finding sufficient numbers of children who are born in, for example, December and January would be both cumbersome and costly.
With access to register data, finding sufficient data is not a problem. According to , the register data for the 1975–1983 birth cohorts contain over 66,000 children with a normal school start who were born in January (0.9964 × 66,361). For December, the corresponding number is over 51,000 (0.9914 × 56,560).
Table 2. Month of birth and timing of school start (percentage points) for the Swedish 1975–1983 birth cohorts.
Consider , which shows the relation between the normal school starting age and GPA. When we compare the children who were born at the end of the year with the children who were born at the beginning of the year, the relation between school starting age and GPA clearly becomes positive; it appears to be better to start school later rather than earlier. This conjecture is verified by Fredriksson and Öckert (Citation2006), who also show positive effects of a later school start on educational attainment and the probability of attaining a college degree.
Figure 4. School starting age, grade point average (GPA) at the end of compulsory school, and season of birth, for the Swedish 1975–1983 birth cohorts. Ninth grade GPA is in percentile ranks. Source: Fredriksson and Öckert (Citation2006).
An example of research using merged survey and register data
The above section, Register data of interest – and information that is lacking, indicates two reasons for merging survey and register data. First, there are certain types of information that are not covered by register data. Secondly, in register data, the links between teachers and students are missing. This section describes an ongoing empirical study that relates to both of these reasons. The object of the study is to evaluate the effects of the teacher support programme NTAFootnote23 on the scholastic achievements in natural sciences, which are measured in terms of grades and results on national standardised tests in the sixth school year.
NTA is an enquiry-based, constructivist programme that is built around a number of experiment tool kits (’boxes’). In 2016, NTA was used in 128 of Sweden’s 290 towns and municipalities, including Sweden’s two largest towns, which makes NTA the largest teaching support programme by far in Sweden.
The NTA is not a part of the Swedish regular system of education. The programme is administered by the organisation NTA School Development. The only way to obtain information on NTA activities and NTA participants is through NTA School Development.
For the years 2011–2014, NTA School Development collected data on all schools that used the NTA programme, specifically the participating students and their teachers, by semester, for the school years 4–6. The data comprise about 40,000 students. Information is also included concerning the particular experiment boxes used, making it possible to characterise the boxes in terms of the natural science subjects of Biology, Chemistry, and Physics. The NTA effects will be evaluated for the school years of 2012/2013 and 2013/2014, in terms of the results on national tests and grades in the three science subjects in the sixth school year, i.e. right after the period during which the students have participated in the NTA programme.
With informed consent from the NTA teachers, the NTA students and their parents, the survey data that are collected by the NTA School Development programme are matched with register data through the unique personal identification numbers of the NTA students and teachers and the unique workplace codes of the NTA schools. This process yields information on NTA students regarding the family background and scholastic achievements in the third school year (national test results in Swedish and Mathematics) and in the sixth school year (national test results and grades in the natural science subjects, and test results and grades for several other subjects). The national test results and grades in the natural science subjects in the sixth year are outcome variables, while the third year test results control for pretreatment scholastic aptitude, and the test results and grades in non-science subjects in the sixth year control for post-treatment scholastic aptitude. Moreover, the register data contain detailed information on the education and work experiences of the NTA teachers, the schools that the NTA students attended, and the municipalities and regions where the schools are located.
All of the information concerning the potential comparison group – the students who did not participate in NTA in 2011–2014 but attended sixth grade in either of the school years 2012/2013 or 2013/2014 – is extracted from register data. The registers also provide information on the schools that these students attended and the municipalities where the schools were located.
The assessment of the effects of the NTA programme proceeds in two steps. First, non-NTA students who act as synthetic twins to the NTA participants are selected from the students in the potential comparison group. This is achieved through propensity score matching, a method that is based on regression analysis (Guo & Fraser, Citation2010). In the second step, the effects of the NTA programme are determined by comparing the test results and grades in the natural science subjects in the sixth school year between the NTA and non-NTA students. The subject effects will be allowed to vary with the number of semesters that the NTA students have participated in the programme, the type of NTA boxes that are used, and the characteristics of the NTA teachers.
Evaluations of the causal effects of educational interventions
An important application of register data is to the evaluations of the causal effects of educational interventions, i.e. the establishment of covariation that goes beyond correlations and identifies a direction of effect. This issue has already been touched on in the two preceding sections. In the first of these two sections, the causal effects of school starting age on scholastic achievements were estimated, whereas the other section concerned the effects of the Swedish NTA programme on scholastic achievements. As these two examples show, causal effects can be estimated with register data only (the first example) or through register data in conjunction with survey data (the second example).
The essential feature of a causal effect evaluation is that it identifies a counterfactual treatment or event that describes what would have occurred had the intervention not taken place. Valid counterfactuals can be defined only if the implementation of the intervention satisfies certain conditions. Three different conditions can be distinguished, namely, randomised experiments,Footnote24 natural experiments, and quasi-experiments.
In randomised experiments, the ‘treatment’, i.e. the intervention, will not involve all individuals who may benefit from it but only a randomly selected subset of them. The individuals in the other, not selected, subset constitute the counterfactuals; they act as a control, or comparison, group. The effect of the intervention is simply determined by comparing the average outcomes in the treatment group with the average outcomes in the control group.
Randomised experiments are very rare in education and training. One example is provided by Jensen, Holm, and Bremberg (Citation2013); a teacher support programme comprising different aspects on preschool pedagogics was randomly assigned to comparable preschools in two Danish municipalities. Both register data and survey data were employed in the effect evaluation. The results showed that the treated children exhibited fewer emotional problems, were less hyperactive, and were more attentive than the children in the control group. An evaluation of the returns to college in Sweden, by Öckert (Citation2010), provides another example of a randomised experiment; at the margin, some students were granted entry through lotteries.
Natural experiments are events that, by chance, have occurred such that they can be considered experiments, although no randomisation has occurred. The study on the effects of school starting age that is described above can be viewed as a natural experiment, exploiting the fact that the timing of births immediately before and after 31 December can be considered as random.
In the Nordic countries, the most well-known examples of natural experiments concern the introduction of compulsory school. In Sweden, Norway, and Finland, the corresponding policy reforms were implemented progressively, concerning both time and space. As a result, during the process, similar municipalities could be observed that had and had not implemented the new system. The effects of the reform were estimated by comparing the achievements of students of the same age who simultaneously attended schools where the reform was implemented earlier and later (Meghir & Palme, Citation2005; Pekkarinen, Uusitalo, & Kerr, Citation2009; Aakvik, Salvanes, & Vaage, Citation2010). One effect was a small increase in the average years of schooling. Lifetime earnings were also affected – for the better for children with low-educated parents and for the worse for children with well-educated parents.
In contrast to natural experiments, quasi-experiments refer to situations in which there is no random distribution across the treatment group and the control group. The planned evaluation of the effects of the NTA programme will be performed in the form of a quasi-experiment. Specifically, students who did not participate in the programme but were very similar to the participating students in all other relevant respects will be selected through a statistical matching method (Guo & Fraser, Citation2010).
Another example of a quasi-experiment is Hall’s (Citation2012) evaluation of the prolongation of Swedish upper secondary vocational education from 2 to 3 years. Similarly to the compulsory school reform, this reform was implemented gradually, making it possible to compare students attending 3 year programmes with similar students attending the corresponding 2 year programmes. To account for the non-random selection into the two types of programme, Hall (Citation2012) employed an instrumental variable (IV) method (Cameron & Trivedi, Citation2005). The IV method substitutes the students’ actual programme choices with an indicator – an instrument – that is correlated with the actual choices that are made by the students, but not with either the outcomes of the programmes or the students’ characteristics. Hall’s (Citation2012) instrument was the availability of the 3 year programmes in the municipalities considered, measured as the proportion of the 3 year programmes among all upper secondary vocational programmes. The effect evaluation showed that the prolongation of the vocational programmes increased the likelihood of students dropping out of upper secondary school and had no effect on transitions to higher education.
Concluding discussion
To provide a full account of the wealth of register data in the Nordic countries is an insurmountable task. Fortunately, it is unnecessary to do so because users are interested in limited subsets of the register universe. Nevertheless, to use register data efficiently, it is necessary to understand the basic principles on which they are built. In this article, the dual need for overview and detail has been resolved by describing register data both in very general terms and in rather specific terms, the specific terms focusing on informational content from an educational science perspective. Moreover, a quite extensive discussion has been devoted to the issue of obtaining access to register data, because this is where most first-time users stumble.
Often, the best way to promote a new instrument – such as register data for (most) educational scientists – is to show, with concrete examples, what it can do. To this end, practical applications have been discussed, which illustrate the advantages of using register data.
The article’s main conclusions can be summarised as follows.
First, register data contain much interesting information for educational scientists. In addition, because register data are panel data – repeated observations of the same individuals and organisations – it is possible to control for aspects on which the registers are not informative, if these aspects remain unchanged over the period under study. Register data also contain intergenerational links, which enable, for instance, studies of the influence of family background on learning and the separation of genetic and environmental factors.
Secondly, register data have one important shortcoming: they cannot directly connect students/learners with their teachers/instructors. Only indirect links through the school, university, or learning site are available. However, this problem can be overcome by matching register data with survey data that contain information on which students have been taught by which teachers.
Thirdly, simply by containing very large numbers of observations, register data enable analyses that are very difficult – or impossible – to address through interview or survey data.
Fourthly, combinations of register-based statistical analyses and in-depth case studies provide benefits for both qualitatively and quantitatively oriented researchers.
Fifthly, register data are instrumental in evaluations of the causal effects of educational interventions.
Another relevant issue concerns the costs of register data compared with interview or survey data. In general, register data are cheaper because their compilation involves far fewer work hours than the collection and structuring of interview and survey data – hours that a researcher who uses register data can devote to other tasks. This difference generally more than outweighs the costs that are involved when information is extracted from registers.
Furthermore, as noted by Ludvigsson et al. (Citation2015), the data for different registers are compiled independently, which minimises bias in data collection. In addition, in studies with long follow-up periods, outcome information from registers is more reliable than survey information, which may be uncertain because of imprecise personal recall or attrition.
Acknowledgements
I am grateful to Lena Tibell for encouraging me to teach on this topic; my lecture notes were the main input for the article. The helpful comments from Mary James, Caroline Hall, and Sara Martinson are also much appreciated.
Disclosure statement
No potential conflict of interest was reported by the author.
Notes
1. In some non-Nordic countries, register data exist on specific issues. For example, in England there are data for all students who attend state schools concerning their results in national achievement tests (Crawford, Dearden, & Meghir, Citation2010). However, unlike in the Nordic countries, this register cannot be linked to other registers. For instance, it cannot be linked to information on the students’ parents to enable analyses of the possible influences of family background on the test results.
2. See http://ki.se/en/research/the-swedish-twin-registry, accessed February 2017. For analyses of the return to education utilising this register, see Isacsson (Citation1999, Citation2004).
3. For a study that uses this register to analyse the relation between performance in primary school and psychosocial problems in young adulthood among individuals in foster care, see Berlin et al. (Citation2011).
4. Cedefop, the European Centre for the Development of Vocational Training, is a decentralised agency of the European Union (EU). It was founded in 1975 and is based in Thessaloniki, Greece. Cedefop supports the development of European vocational education and training policies and contributes to their implementation.
5. The AES is part of the EU Statistics on lifelong learning and covers people in the age range of 25–64 years. Representative samples of individuals are randomly selected for interviews in each country. The first and second waves of the AES were conducted in 2007 and 2011, respectively. Denmark, Finland, Norway, and Sweden participated on both occasions. In 2011, the samples of the Nordic countries comprised 5000–6000 people, and the response rates were 55–65%. The third wave takes place in 2016 and 2017. See http://ec.europa.eu/eurostat/web/microdata/adult-education-survey, accessed February 2017.
6. The PIAAC is conducted by the Organisation for Economic Co-operation and Development (OECD) and targets individuals aged 16–65. The PIAAC’s primary purpose is to assess skills in literacy, numeracy, and problem solving by means of information and communication technology, but extensive information is also collected on education and training. The first wave of the PIAAC was conducted in 2011–2012 (23 countries) and 2014–2015 (nine countries). Denmark, Finland, Norway, and Sweden participated in 2011–2012; the number of respondents varied between approximately 4500 (for Sweden) and approximately 7300 (for Denmark). For further information, see OECD (Citation2013, Citation2016).
7. For simplicity, other important aspects, such as family background, are disregarded here.
8. To fully control for genetic factors with this approach, one must consider a very specific group of siblings, namely, identical twins.
9. Survey data may also include information that is classified as ‘sensitive’ in the Danish, Icelandic, Norwegian, and Swedish Personal Data Acts. Beside health information, data on political, religious, and sexual disposition are classified as sensitive. Any inclusion of these types of data requires an ethics review.
10. The country’s central ethics committee can always advise whether an ethics review is required. The web addresses of the central committees are: Denmark: www.cvk.sum.dk; Finland: www.tenk.fi; Iceland: www.vsn.is; Norway: www.etikkom.no; and Sweden: www.epn.se (accessed February 2017).
11. The national statistical agencies are Statistics Denmark, Statistics Finland, Statistics Iceland, Statistics Norway, and Statistics Sweden.
12. Information regarding which institutions to contact can be obtained from the national statistical agencies.
13. Backward identification is illegal; researchers handling pseudonymised data are often required to acknowledge, in writing, that they are aware of this restriction.
14. Presumably, this difference exists because, unlike ethics review committees, data-administering organisations consider only the risks of violating personal integrity, not the project’s social benefits.
15. At the time of the writing of this article, remote access was not used in Norway; instead, the researchers were provided with copies of the data, stored locally.
16. Of course, educational science is not the only discipline forgoing the opportunities provided by multi-methodological approaches.
17. For example, a logistic regression can be applied (Hosmer & Lemeshow, Citation2000). In such a regression, the dependent variable is binary: 1 if the student chooses a science track in upper secondary school and 0 otherwise. The explanatory variables are binary variables that indicate gender and school, respectively, and the products of these two variables, plus non-binary variables representing family background and scholastic achievements.
18. This measure is given by the estimated parameter for the binary gender variable, coded 1 for girls and 0 for boys.
19. This information is provided through the estimated parameters for the gender × school variables.
20. Another complication arises if the students can choose which school to attend. This results in a selection problem, similar to the selection problem discussed in connection with the qualitative approach. The outlined analysis then needs to be preceded by an analysis of school choice.
21. Since 1997, the starting age has been 6 years in Norway (e.g. Mellander & Fremming Anderssen, Citation2015).
22. For similar analyses of Norway and England, see Black, Devereux, and Salvanes (Citation2011) and Crawford et al. (Citation2010), respectively.
23. In English: Natural Sciences and Technology for All. For a description of this programme, see Mellander and Svärdh (Citation2015, 2017).
24. Randomised experiments are also denoted randomised control trials (RCTs).
References
- Aakvik, A., Salvanes, K. G., & Vaage, K. (2010). Measuring heterogeneity in the returns to education using an education reform. European Economic Review, 54(4), 483–500. doi:10.1016/j.euroecorev.2009.09.001
- Berlin, M., Vinnerljung, B., & Hjern, A. (2011). School performance in primary school and psychosocial problems in young adulthood among care leavers from long term foster care. Children and Youth Services Review, 33(12), 2489–2497. doi:10.1016/j.childyouth.2011.08.024
- Black, S., Devereux, P., & Salvanes, K. (2011). Too young to leave the nest? The effects of school starting age. Review of Economics and Statistics, 93(2), 455–467. doi:10.1162/REST_a_00081
- Cameron, A. C., & Trivedi, P. K. (2005). Microeconometrics, methods and applications. New York: Cambridge University Press.
- Cedefop. (2014). Terminology of European education and training policy: A selection of 130 items (2nd ed.). Luxembourg: Publications Office.
- Crawford, C., Dearden, L., & Meghir, C. (2010). When you are born matters: The impact of date of birth on educational outcomes in England. (IFS Working Paper, W10/06). London: Institute for Fiscal Studies.
- Fredriksson, P., & Öckert, B. (2006). Is early learning really more productive? The effect of school starting age on school and labor market performance. (IFAU Working Paper 2006:12). Uppsala: Institute for Evaluation of Labor Market and Education Policy.
- Fredriksson, P., & Öckert, B. (2014). Life-cycle effects of age at school start. Economic Journal, 124, 977–1004.
- Guo, S. Y., & Fraser, M. W. (2010). Propensity score analysis: Statistical methods and applications. New York: Sage.
- Gustafsson, J. –. E. (2003). What do we know about effects of school resources on educational results? Swedish Economic Policy Review, 10, 77–110.
- Hall, C. (2012). The effects of reducing tracking in upper secondary school: Evidence from a large-scale pilot scheme. Journal of Human Resources, 47(1), 237–269. doi:10.1353/jhr.2012.0003
- Hattie, J. (2009). Visible learning. A synthesis of over 800 meta-analyses relating to achievement. New York, NY: Routledge.
- Hosmer, D. W., & Lemeshow, S. (2000). Applied logistic regression (2nd ed.). New York: Wiley.
- Hsiao, C. (1986). Analysis of panel data. New York: Cambridge University Press.
- Isacsson, G. (1999). Estimates of the return to schooling in Sweden from a large sample of twins. Labour Economics, 6(4), 471–489. doi:10.1016/S0927-5371(98)00014-1
- Isacsson, G. (2004). Estimating the economic return to educational levels using data on twins. Journal of Applied Econometrics, 19(1), 99–119. doi:10.1002/(ISSN)1099-1255
- Jensen, B., Holm, A., & Bremberg, S. (2013). Effectiveness of a Danish early year preschool program: A randomized trial. International Journal of Educational Research, 62, 115–128. doi:10.1016/j.ijer.2013.06.004
- Ludvigsson, J. F., Håberg, S. E., Knudsen, G. P., Lafolie, P., Sarkkola, C., von Kraemer, S., … Nørgaard, M. (2015). Ethical aspects og registry-based research in the Nordic countries. Clinical Epidemiology, 7, 491–508. doi:10.2147/CLEP.S90589
- Meghir, C., & Palme, M. (2005). Educational reform, ability, and family background. American Economic Review, 95(1), 414–424. doi:10.1257/0002828053828671
- Mellander, E., & Fremming Anderssen, A. (2015). An overview of the characteristics of the Nordic region; Chapter 1. In: Adult skills in the Nordic region: key information-processing skills among adults in the Nordic Region. TemaNord 2015:535, Nordic Council of Ministers. Copenhagen: Rosendahls-Shultz Grafisk.
- Mellander, E., & Svärdh, J. (2015). Inquiry-based learning put to test: Long-term effects of the Swedish Science and Technology for Children program. (IFAU Working Paper 2015:23). Uppsala: Institute for Evaluation of Labour Market and Education Policy.
- Mellander, E., & Svärdh, J. (in press). Tre lärdomar från en effektutvärdering av lärarstödsprogrammet NTA [Three lessons from an effect evaluation of the Swedish Science and Technology for Children program]. Nordic Studies in Science Education (NorDiNa).
- Öckert, B. (2010). What’s the value of an acceptance letter? Using admissions data to estimate the return to college. Economics of Education Review, 29, 504–516. doi:10.1016/j.econedurev.2009.12.003
- OECD. (2013). OECD Skills 2013: First results from the survey of adult skills. Paris: OECD Publishing.
- OECD. (2016). Skills matter: Further results from the survey of adult skills, OECD skills studies. Paris: OECD Publishing.
- Pekkarinen, T., Uusitalo, R., & Kerr, S. (2009). School tracking and intergenerational income mobility: Evidence from the Finnish comprehensive school reform. Journal of Public Economics, 93(7–8), 965–973. doi:10.1016/j.jpubeco.2009.04.006
- Rosdahl, A. (2015). PIAAC Nordic database guidelines_15 October 2015_DRAFT. Mimeo. Copenhagen: Danish National Centre for Social Research (SFI).
- Vetenskapsrådet. (2015). Forskningens framtid! Ämnesöversikt 2014: Utbildningsvetenskap [The future of research! Overview of Educational science 2014]. Stockholm: Vetenskapsrådets rapporter.