
ABSTRACT
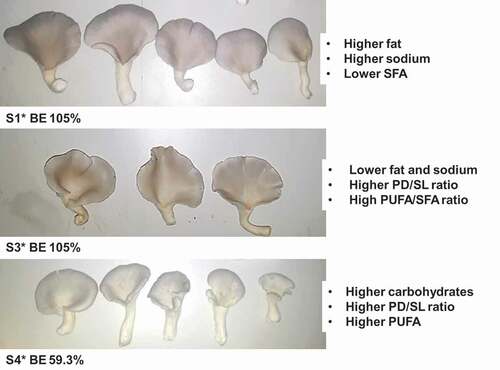
The capacity of Pleurotus ostreatus to degrade the lignocellulose of spent coffee grounds (SCG) and its resultant nutrient composition is not yet studied. The study tested four SCG/wheat straw mixtures, containing 0, 33, 67, or 100% SCG. Initial lignin content was higher, and lignin loss was lower in mixtures containing SCG, compared to control revealing lower substrate degradation. Biological yield was negatively correlated with initial lignin content, and positively with the lignin loss from substrates. The nutritional value of mushrooms was improved by a general increase in carbohydrates, a decrease in sodium content with 33% and 67% SCG, and lower fat content with 33% SCG. Polyunsaturated fatty acids of mushrooms (PUFA) increased with 67% SCG; while saturated ones (SFA) increased with 33 and 67% SCG. All mushrooms had a close PUFA/SFA, ranging between 7.4 and 8.1. The study suggests using SCG as a nutritional supplement to the commercial wheat straw.
Graphical abstract
RESUMEN
Aún no se ha estudiado la capacidad de Pleurotus ostreatus (champiñón ostra, o seta) para degradar la lignocelulosa de los desechos de café molido (SCG) y su consiguiente composición de nutrientes. El presente estudio probó cuatro mezclas de SCG/paja de trigo, que contenían 0, 33, 67 o 100% de SCG. En comparación con el control, que reveló una menor degradación del sustrato, el contenido inicial de lignina fue mayor y en las mezclas que contenían SCG la pérdida de lignina fue menor. El rendimiento biológico se correlacionó negativamente con el contenido inicial de lignina y lo hizo positivamente con la pérdida de lignina de los sustratos. El valor nutritivo de los champiñones mejoró debido a un aumento general de los carbohidratos, una disminución del contenido de sodio, en las mezclas que contenían 33% y 67% de SCG, y un menor contenido de grasa en la mezcla que contenía 33% de SCG. Los ácidos grasos poliinsaturados de los champiñones (PUFA) aumentaron en la mezcla con 67% de SCG; mientras los saturados (SFA) se incrementaron en aquellas con 33% y 67% de SCG. Todos los champiñones tuvieron un índice PUFA/SFA semejante, que oscilaba entre 7.4 y 8.1. En conclusión, este estudio sugiere usar SCG como suplemento nutricional de la paja de trigo comercial.
1. IntroductionFootnote1
Pleurotus mushrooms rank second in the total global mushroom production (Royse, Citation2014). In commercial production, they are important the because of their gastronomic qualities and nutritional value (Carrasco-Cabrera et al., Citation2019). Pleurotus ostreatus is particularly treasured because of its carbohydrates, vitamins, and minerals contents (Cheung, Citation2010). It is a low fat (Tolera & Abera, Citation2017) and a low-calorie mushroom, with low sodium contents (Patil et al., Citation2010). It holds various medicinal properties and helps reducing different health risks (Khan & Tania, Citation2012).
As saprophyte, the mushroom grows on dead wood and other lignocellulosic substrates (Cohen et al., Citation2002). It is a primary decomposer, which grows by bioconversion of agro-industrial wastes (Ritota & Manzi, Citation2019). Hence, it helps recycling and reuse of wasted materials and reducing their negative effect on the environment (Mussatto et al., Citation2012).
The expensive importation and acquisition of commercial substrate had previously led to the use of locally available agro-industrial wastes (Abou Fayssal et al., Citation2020; Naim et al., Citation2020a, Citation2020b; Sassine et al., Citation2007; El Sebaaly et al., Citation2018a, Citation2018c, Citation2018b, Citation2019) in mushroom production. At industrial scale, P. ostreatus is cultivated on cereal straw, mainly wheat straw (Labuschagne et al., Citation2000), which is becoming less available in many world regions causing constraints for oyster production (Picornell-Buendía et al., Citation2016).
Otherwise, coffee wastes generated by the coffee industry are rich in organic compounds (Campos-Vega et al., Citation2015), and have been recently considered for P. ostreatus production (Carrasco-Cabrera et al., Citation2019). Studies reported the mushroom growth on coffee husks (Da Luz et al., Citation2012), coffee pulp (García et al., Citation2011), and spent coffee grounds (SCG) (Fan et al., Citation2000). According to Fan et al. (Citation2000) the use of SCG without any pre-treatment in the production of P. ostreatus is economically feasible, while Carrasco-Cabrera et al. (Citation2019) noted that increasing proportions of SCG in SCG/sawdust substrates has delayed or prevented fruiting. Furthermore, the effect of SCG used in SCG/wheat straw substrates on the mushroom production and the nutritional value is not yet described. Effectively, the latter varies with the substrate type and chemical composition (Abou Fayssal et al., Citation2020), due to the mushroom capacity to absorb the chemical compounds from the substrate (Koutrotsios et al., Citation2020).
Coffee is one of the most important food commodities in the world (Murthy & Naidu, Citation2012) and waste of the coffee industry are globally generated in more than six million tons per year (Tokimoto et al., Citation2005). In Lebanon, huge quantities of coffee wastes (26.417 tons in 2016) are generated by local coffee shops (Blom Invest Bank, Citation2017). The disposal of these wastes into the environment would cause serious environmental problems (Shimelis, Citation2011).
Therefore, the present work tested the effect of SCG/wheat straw substrates containing local SCG in proportions of 0, 33, 67, or 100% on the growth, production, and the chemical composition of P. ostreatus mushroom. The study target was to provide a way to valorize these wastes in the production of a nutritious food.
2. Materials and methods
2.1. Experimental treatments
The experiment assessed the effect of different substrates on the production and nutritional composition of P. ostreatus. It was set as a complete randomized design with four treatments (substrates) and ten replicates (10 bags per treatment). Tested substrates were: S1: 100% wheat straw (pH: 5.5, EC: 0.3 mS/cm, OM: 86.6%, C/N ratio: 69:1), S2: 100% spent coffee grounds (pH: 4.9, EC: 1.4 mS/cm, OM: 98.0%, C/N ratio: 19:1), and two mixtures of WS and SCG on volume basis; S3: 67%WS+33%SCG (pH: 5.3, EC: 1.2 mS/cm, OM: 92.0%, C/N ratio: 43:1), and S4: 33%WS+67%SCG (pH: 5.3, EC: 1.6 mS/cm, OM: 93.2%, C/N ratio: 30:1).
2.2. Substrate preparation, spawning and incubation
Fresh wheat straw was sourced from a local private farm and spent coffee grounds were provided by Zero Waste Act, a waste segregation green project. SCG consisted of the waste created by brewing coffee during its final preparation stages. Both types of substrates were sun-dried for two days before use. They were pasteurized using hot water at 60–65°C for eight hours and then allowed to cool down to reach the suitable spawning temperature of 25°C. Spawning was done with a rate of 5% w/w using wheat grain spawn of P. ostreatus M 2175 strain, imported from Mycelia Company, Deinze, Belgium, prepared in glass jars of 200 mL. In addition, 50 g of gypsum CaCO3 (2% w/w in terms of dry weight) were added at spawning in order to adjust the substrate pH. Transparent polyethylene bags of 1 kg were filled by the spawned substrates filled, incubated in complete darkness, at a temperature of 23–25°C and a high relative humidity of 85–90%. Holes were made on the bags lateral sides to allow gas exchange. At complete colonization, bags were moved into a cropping chamber where lighting (200 LUX light source for 12 h day−1), low room temperature of 16°C, and ventilation (CO2 levels lower than 900 mg L−1) were adopted to trigger the pinhead formation, thus fruit formation.
2.3. Evaluation of mushroom production
In order to monitor the mycelial growth, squares (5 × 5 cm) were drawn on bags before filling them with the substrate. The whiteness of all squares indicated the time of complete mycelial colonization (100% MC). The time to pinhead initiation (PN) and to first harvest (H1) were recorded as the number of days after spawning (DAS). Production at the level of each treatment was evaluated by assessing the number of harvests, number and weight of bunches (g bag−1), number and weight of mushrooms (g bag−1), biological yield (g bag−1), and economic yield (g bag−1). Fruit bodies were weighed following the removal of stalks bases, and the number corresponded to the economic yield (g bag−1) (Girmay et al., Citation2016). Besides, the biological efficiency (BE) indicated the ratio of fresh mass of mushrooms (G) over the initial dry mass of substrate (g), expressed as percentage. Stipe characteristics were evaluated in terms of stipe diameter and stipe length (cm). Additionally, the pileus diameter was used to calculate the ratio PD/SL, on ten uniform samples of mushrooms per each treatment.
2.4. Chemical analysis
Analysis of substrate properties (at LARI laboratories) included the pH (using UltraBasic-UB10; Denver pH meter), electro-conductivity (using SC-2300 conductivity meter; Suntex Instrument), total organic matter content (via loss of ignition method at 430°C over 24 h), moisture content (using Moisture Analyzer, Sartorius Instrument, Model MA37), and C/N ratio (using CHN Analyzer with automatic sampler, Carlo-Erba elemental analyzer, Model 1106). The remaining tests on substrates and mushrooms were performed at the LFDCA. The total protein content was determined using the Micro-Kjeldahl method (N x 6.25 for substrates, N x 4.38 for mushrooms; Reis et al., Citation2012). Regarding substrates and mushrooms, the total carbohydrates analysis followed the Anthrone method (Hammond, Citation1980), and the fat content used the Soxhlet apparatus for a continuous extraction (Association of Official Chemistry [AOAC], Citation1984). Crude fiber content was determined using an enzymatic gravimetric method of analysis based on AOAC (Citation1990) for substrates, and based on AOAC (Citation1995) procedures for mushrooms.
For the analysis of sugar composition, samples were heated for 30 min at 100°C in water, then 20 µl of filtrate were injected into High-Performance Liquid Chromatography (HPLC) (normal phase extraction, column: NH2 250*4.5 mm ID, flow rate: 1.2 mL min−1, temperature: 30°C, detection: RID dilution, refraction index detector, mobile phase: mixture of polar and non-polar solution, standard: prepared from stock solution of sugars to get concentration approximate to sample, calibration done using 2 points concentration). For the determination of fatty acids, 1 ml of methanolic KOH (0.4 N) were added to 10 mg of the samples. This was followed by heating for about 10 min at 75°C for homogenization, addition of 300 µl of BF3 (14% methanol), heating again for 30 min at 100°C, thus, two layers were formed. The following steps included the addition of 1 mL NaCl, shaking, addition of 2 mL n-Hexane, shaking again, and centrifugation at 1372 G-force (RFC) for 10 min. Subsequently, the hexane layer was injected in Gas chromatography with Flame Ionization Detector (GC-FID). Fatty acid determination in the substrates referred to Nieto and Chegwin (Citation2013).
Fiber fractions analysis in initial and residual substrates (cellulose, hemicellulose, lignin, NDF, ADF, and ADL) used the ANKOM technology method filter bag technique (08–16-06, 08–05), based on AOAC official methods of analysis (Association of Official Chemistry [AOAC & AOAC], Citation2019). On substrate samples, the analysis of mineral composition (K, Ca, Mg, Na, Fe, and Mn) made use of the atomic absorption spectrophotometry (AOAC, Citation1984). On dried mushroom samples, same minerals were measured via the Inductively Coupled Plasma-Atomic Emission Spectrophotometry (ICP-AES) after element extraction in 0.1 N HCl acidic solution. Tests on substrates were performed in triplicates, while those on mushrooms in pentuiplicates.
2.5. Statistical analysis
One-way ANOVA and Duncan tests were applied for data analysis using SPSS 25® program. Stepwise regressions were performed to test the relation of the biological yield (dependent variable) to substrate components and mushroom pileus and stipe indicators (predictors), as well as the relation between the biological yield and the lignin content of initial substrates and the lignin loss. Additionally, Partial Least Squares Regression (PLSR) was applied for multivariate analysis, using XLSTAT. Jackknife (LOO) test was used for cross-validation of the resulting models. A confidence level of 95% was adopted for all statistical tests.
3. Results and discussion
3.1. Effect of substrate on mushroom production
The mycelium did not completely colonize the substrate S2, which contradicts the findings of Fan et al. (Citation2000). The poor mycelial colonization may be explained by the richness of SCG in caffeine (10–25 μmol g−1) (Campos-Vega et al., Citation2015), which was reported to inhibit mycelial growth (Carrasco-Cabrera et al., Citation2019). It could be due as well to the very low C/N ratio of S2, not suitable for the species requirements. Earlier, Alborés et al. (Citation2006) indicated that the substrate C/N ratio and the mycelium growth rate are positively correlated.
In comparison with control (), there was a respective delay in the stages of complete mycelial colonization and pinhead initiation by 1.0 and 2.7 d in S3, and by 1.3 and 6.0 d in S4. The delay in S4 might be caused by the substrate’s high lignin content. Effectively, lignin is a complex polymer, which forms a barrier prohibiting the mushroom from attacking other polysaccharides; it must first be degraded to allow access to holocellulose in the plant material cell wall (Xiao et al., Citation2017). Furthermore, despite the delay in mycelial growth and pinhead initiation in S3, the timing of fruit formation was comparable to control, biological yield and biological efficiency were high (814.6 g/bag and 105%). The number of harvests and of bunches decreased by 1.0 and 6.7 in S4, and increased by 1.7 and 5.7 in S3, compared to control. Though the bunches’ weight decreased by 35.4 g in S3, fruit body weight increased by 6.3 and 7.3 g in S3 and S4, respectively. The biological yield, economic yield and biological efficiency were cut by half in S4, compared to control. Decreasing proportions of wheat straw was correlated to a gradual decrease in biological yield, mostly due to the gradual decrease of the C/N ratio and the increase of lignin content in the substrates.
Table 1. Substrate effect on various indicators of mushroom growth and production.
Tabla 1. Efecto del sustrato en varios indicadores de crecimiento y producción de champiñones
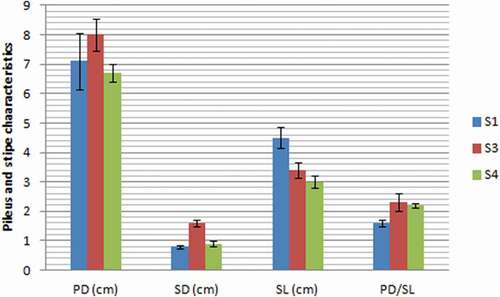
The substrate type had a statistically significant effect on averages of stipe diameter (p = .000), stipe length (p = .002) and PD/SL (p = .007), but not on pileus diameter (p = .135). In comparison with control, stipe diameter () increased by 0.1 in S3 and 0.8 cm in S4, and pileus diameter increased by 0.9 cm in S3. Mushrooms obtained in all treatments were marketable showing a high PD/SL ratio (Synytsya et al., Citation2008) with promising values of PD/SL for those harvested from substrates containing SCG.
Figure 1. Pileus and stipe characteristics of mushrooms grown on different substrates (Values are means ± SD; for each indicator, means followed by the same letter are not statistically significant at p < .05 according to Duncan’s multiple range test; S1: 100%WS, S3: 67%WS+33%SCG, S4: 33%WS+67%SCG, SD: stipe diameter, PD: pileus diameter, SL: stipe length, WS: wheat straw, SCG: spent coffee grounds).
Figura 1. Características del pilo y del estipe de los champiñones cultivados en diferentes sustratos (los valores son medias ± DE; para cada indicador, las medias seguidas de la misma letra no son estadísticamente significativas a p < .05, según la prueba de rango múltiple de Duncan; S1: 100%WS, S3: 67%WS+33%SCG, S4: 33%WS+67%SCG, SD: diámetro del estipe, PD: diámetro del pilo, SL: longitud del estipe, WS: paja de trigo, SCG: desechos de café molido)
3.2. Effect of substrate on mushroom composition
Results in showed that the total protein content was higher in S3 and S4 than in S1 (by 3.5% and 6.6% respectively), and lower in mushrooms of these substrates than in those of S1 (by around 0.5% and 0.3% respectively). Control substrate and control mushrooms were the richest in crude fiber. Total carbohydrates content was the highest in S1, however, S1 mushrooms were poorer in this component (by 1.3%) compared to S4 mushrooms.
Table 2. Mushrooms (% fresh weight) and initial substrates (%dry weight) composition.
Tabla 2. Composición de los champiñones (% peso fresco) y sustratos iniciales (% peso seco)
Fat content was lower in S3 mushrooms in comparison with control mushrooms. Control substrate was the richest in total soluble sugars, including fructose, glucose and sucrose compared to remaining substrates. However, mushrooms of S3 and S4 were the richest in total soluble sugars. Glucose was the most abundant sugar in all substrates. Mushrooms had in general a very low sucrose content compared to glucose and fructose contents. The latter were lower in mushrooms of S3 and S4 compared to S1.
Analysis of mineral composition () showed that the calcium content was the highest in mushrooms of S1 and S4. Besides, manganese and potassium contents were lower in S3 and S4 substrates than in S1, while manganese was lower in mushrooms of S3 and S4, compared to those of S1. Potassium and iron contents increased only in S4 mushrooms. Despite higher sodium and magnesium contents in S3 and S4, mushrooms obtained in these substrates had lower sodium content and almost similar magnesium content in comparison with control mushrooms.
Table 3. Mineral composition of initial substrates and mushrooms (% dry weight).
Tabla 3. Composición mineral de los sustratos iniciales y los champiñones (% de peso seco)
3.3. Fiber fractions analysis
Analysis of the initial substrates () showed that S1 was richer in hemicellulose and cellulose, but poorer in lignin compared to S3 and S4.
Figure 2. Variation of fiber fractions between initial and residual substrates (Values are means ± SD; for each indicator, different letters indicate a statistically significant difference at p < 0.05); S1: 100%WS, S3: 67%WS+33%SCG, S4: 33%WS+67%SCG.
Figura 2. Variación de las fracciones de fibra entre los sustratos inicial y residual (los valores son medias ± DE; para cada indicador, las distintas letras indican una diferencia estadísticamente significativa en p < 0.05); S1: 100%WS, S3: 67%WS+33%SCG, S4: 33%WS+67%SCG
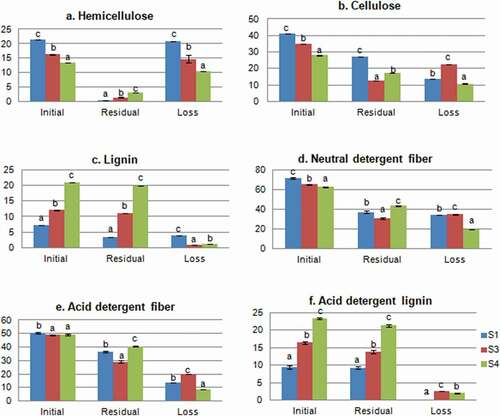
Additionally, the analysis of the residual substrate’s composition demonstrated a higher loss in hemicellulose than in cellulose contents. Cohen et al. (Citation2002) previously affirmed the selectivity of degradation of P. ostreatus. In specific, hemicellulose loss was higher in S1 than in S3 and S4 (20.76, 14.80, and 10.45% respectively), while cellulose loss was the highest in S3 (22.5%). Hemicellulose, cellulose, and lignin serve as source of energy for the mushroom growth, because they contain carbon, hydrogen, and oxygen, which explain their decrease along the mushroom production cycle (Andrade et al., Citation2010). P. ostreatus uses complex oxidative and hydrolytic enzymes to decompose these components (Fernández-Fueyo et al., Citation2016). Upon break, cellulose yields simple sugars, which provide energy for the mycelial growth (Stamets & Chilton, Citation1983).
ADL fractions decreased by 2.05 and 2.62% in S3 and S4 and by 0.12% in S1. Lignin loss was the highest in S1, indicating a higher mycelial activity (Zadrazil et al., Citation1996) in this substrate compared to others.
3.4. Regression analysis
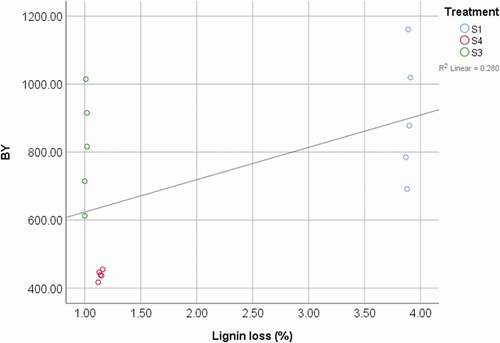
The stepwise regression analysis showed that among all productive indicators, the total biological yield was the most strongly correlated to mushroom number and stipe length (BY = 11.3 × MN + 211.2 x SL – 409.0, r2 = 0.76). Besides, among the different substrate components, total carbohydrates had the strongest positive influence on the total biological yield obtained in the different substrates (BY = 100.83 × Total carbohydrates – 2987.80, r2 = 0.69). Furthermore, there was a negative correlation between the biological yield and the initial lignin content in substrates (BY = – 37.94 x Lignin + 1204.00, r2 = 0.689), and positively correlated with the lignin loss (BY = 95.08x + 5.29E2, r2 = 0.280) ().
Figure 3. Relation between biological yield (BY) and loss of lignin (BY = 95.08x + 5.29E2 (r2 = 0.280); S1: 100%WS, S3: 67%WS+33%SCG, S4: 33%WS+67%SCG.
Figura 3. Relación entre el rendimiento biológico (BY) y la pérdida de lignina (BY = 95.08x + 5,29E2 (r2 = 0,280); S1: 100%WS, S3: 67%WS+33%SCG, S4: 33%WS+67%SCG
3.5. Fatty acid composition of mushrooms
The analysis of the fatty acid profile of pure SCG showed that it contained 41.2% linoleic acid, 9.7% oleic acid, 9.6% stearic acid, 3.6% linolenic acid and 0.9% arachidic acid. Fatty acid composition of productive substrates and their relative mushrooms are presented in . Palmitic acid was the most abundant in S1, while linoleic acid was more abundant in S3 and S4. The presence of palmitic and palmitoleic acids in the substrates is due to the wheat straw presence because SCG did not initially contain both fatty acids. Linoleic acid content was higher in mushrooms than in substrates, and it was the highest in S4 mushrooms. Linolenic acid, which was initially present in S3 was absent in its mushrooms. Palmitoleic acid, initially absent in S3 and S4, was found in their mushrooms. Mushrooms of S1 and S3 contained around 80.8% polyunsaturated fatty acids, while those of S4 contained around 83.2%. The substrates S3 and S4 were richer in oleic acid compared with S1, but they produced mushrooms of lower oleic acid content (reduction by 1.3% and 3.6% in S3 and S4, respectively). Arachidic acid, initially present in S3 and S4, was absent in mushrooms of these substrates. This suggests its complete conversion into other components by the oyster mushroom. The substrates S3 and S4 were richer in stearic acid than S1, because stearic acid content was initially higher in SCG than in wheat straw. However, S4 mushrooms were poorer in stearic acid compared to those of S1. Additionally, the monounsaturated fatty acids decreased by 0.91% and 2.88% in mushrooms of S3 and S4 compared with S1 mushrooms. Although PUFA/SFA was the highest in mushrooms of S1 (8.1), it was close in those of S4 (8.0) and S3 (7.4). Effectively, foods with relatively high PUFA/SFA ratio are healthy and have a strong hypocholesterolemic effect (Chang & Huang, Citation1998). In terms of human dietary intakes, saturated fatty acids are known to increase low-density-lipoprotein (LDL) level and lead to diabetes, while polyunsaturated fatty acids reduce its risks and lower coronary heart disease events (Food and Agriculture Organization of the United Nations [FAO], Citation2010).
Table 4. Fatty acids profiles of initial substrates and mushrooms (dry basis, % of total fatty acid).
Tabla 4. Perfiles de ácidos grasos de los sustratos iniciales y los champiñones (base seca, % de ácido graso total)
3.6. Relation of mushroom fatty acids to substrate composition
The partial least squares regression (PLSR) analysis defined the interrelationships between the chemical composition of substrates, such as minerals, fatty acids, total protein, carbohydrates, fat, and crude fiber (as independent variables represented by the X-matrix), and the mushroom fatty acids (as dependent variables represented by the Y-matrix). The root means square error (RMSE) defines the difference between observed and predicted values of a model. RMSE was low for all built models (), indicating a good prediction of Y using X values, and a model fitting well to experimental data.
Table 5. Overview of PLSR models for mushroom fatty acids in relation to substrate composition.
Tabla 5. Resumen de los modelos PLSR para los ácidos grasos de los champiñones en relación con la composición de los sustratos
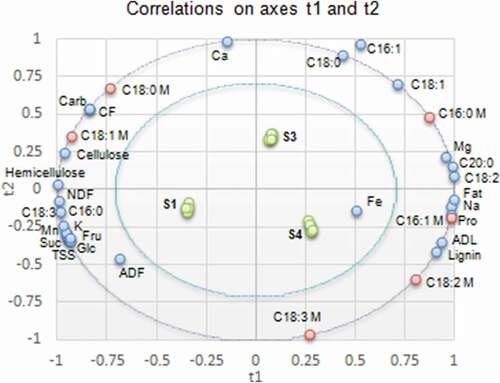
Correlations on axes t1 and t2 between oleic, palmitic, stearic, linoleic, and linolenic acids, and the chemical components of substrates showed two components for X variables and two components for Y variables. On the other hand, the component 1 was enough to predict the correlations between palmitoleic acid and substrate components. In , the presence of X variables (except: iron and palmitoleic acid contents of substrates) and Y variables between the inner and outer ellipses, indicates that correlations between these variables can be well explained by the relative PLSR model.
Figure 4. Correlations between mushroom fatty acids and substrates chemical composition (S1: 100%WS, S3: 67%WS+33%SCG, S4: 33%WS+67%SCG, C16:0: palmitic acid, C16:1: palmitoleic acid, C18:0: stearic acid, C18:1: oleic acid, C18:2: linoleic acid, C18:3: linolenic acid, C20:0: arachidic acid, NDF: neutral detergent fiber, ADF: acid detergent fiber, ADL: acid detergent lignin, M: mushroom).
Figura 4. Correlaciones entre los ácidos grasos de los champiñones y la composición química de los sustratos (S1: 100%WS, S3: 67%WS+33%SCG, S4: 33%WS+67%SCG, C16:0: ácido palmítico, C16:1: ácido palmitoleico, C18:0: ácido esteárico, C18:1: ácido oleico, C18:2: ácido linoleico, C18:3: ácido linolénico, C20:0: ácido araquídico, NDF: fibra detergente neutra, ADF: fibra detergente ácida, ADL: lignina detergente ácida, M: champiñón)
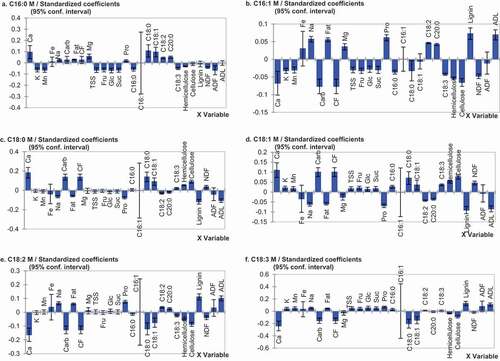
Furthermore, regression coefficients () were calculated in order to investigate significant contribution of X variables to variation of the relative Y variables. Partial least square regression demonstrated that the mushroom palmitic acid co-varied () and was the most positively correlated ()) with the stearic and oleic acids contained in S3. Mushroom palmitoleic acid content co-varied () with fat, sodium, total protein, lignin, and ADL contents of S4 and with magnesium, arachidic, and linoleic acids contents of S3. Variation in the palmitoleic acid content in mushrooms was the most positively affected by the lignin and ADL contents, and negatively by total carbohydrates and crude fiber contents of the substrates ()). Mushroom stearic acid content was positively influenced by calcium content and negatively by the lignin content of substrates ()). Such co-variation was distinctive at the level of S3. The correlation between stearic acid in mushroom and substrate suggests the direct uptake of this fatty acid by the mushroom. In the same substrate, the mushroom oleic acid content co-varied with total carbohydrates, crude fiber, calcium, cellulose, and hemicellulose contents (). The first three substrate components had a higher positive influence, while lignin content had a superior negative effect on the mushroom oleic acid content ()). On the contrary, in S4, among all tested substrate components, lignin had a superior positive effect on the mushroom linoleic and linolenic acids ()). The strong correlation between linoleic and linolenic acids contents in mushrooms with lignin and ADL contents of substrates, suggests lignin as a source of these fatty acids.
Figure 5. Regression coefficients and significant indications (shown in streaked bars) for substrate chemical composition variable.
Figura 5. Coeficientes de regresión e indicaciones significativas (mostradas con barras rayadas) para la variable de composición química del sustrato
4. Conclusion
Improvement in many nutritional aspects of P. ostreatus mushroom, grown on wheat straw/SCG substrate suggests SCG as a nutritious potential supplement for the commercial wheat straw. The use of SCG in a low proportion was more advantageous than in higher proportions. Observations on polysaccharides degradation in substrates containing SCG need to be further confirmed in future studies by testing the secretion of the extracellular enzymes in such substrates.
Data availability
Due to the nature of this research as a part of a PhD thesis, participants of this study did not agree for their data to be shared publicly, so supporting data is not available.
Disclosure statement
Authors confirm that there is no conflict of interests from the presented study.
Notes
1. P. ostreatus: Pleurotus ostreatus, SCG: spent coffee grounds, WS: wheat straw, CaCO3: calcium carbonate, MC: mycelial colonization, PN: time to pinhead initiation, H1: time to first harvest, DAS: days after spawning, BE: biological efficiency, PD: pileus diameter, SL: stipe length, EC: electro-conductivity, OM: organic matter, LARI: Lebanese Agricultural Research Institute, LFDCA: Lebanese Food Drugs and Chemicals Administration, AOAC: Association of Official Analytical Chemists, HPLC: High Performance Liquid Chromatography, GC-MS: Gas Chromatography Mass Spectrometry, NDF: neutral detergent fiber, ADF: acid detergent fiber, ADL: acid detergent lignin, HCL: Hydrochloric acid, KOH: Potassium hydroxide, GC-FID: Gas chromatography with Flame Ionization Detector, K: potassium, Ca: calcium, Mg: Magnesium, Na: Sodium, Fe: iron, Mn: Manganese, ICP-AES: Coupled Plasma-Atomic Emission Spectrophotometry, SPSS: Statistical Package for Social Sciences, PLSR: partial least squares regression, HN: harvests number, BN: bunches number, FBN: fruit body number, BW: bunches weight, FBW: fruit body weight, BY: biological yield, EY: economic yield, SD: stipe diameter, Pro: total protein, CF: crude fiber, Carb: total carbohydrates, TSS: total soluble sugars, FRU: fructose, GLC: glucose, SUC: sucrose, PUFA: polyunsaturated fatty acids, MUFA: monounsaturated fatty acids, SFA: saturated fatty acids, C18:2: linoleic acid, C18:3: linolenic acid, C16:1: palmitoleic acid, C18:1: oleic acid, C20:0: arachidic acid, C16:0: palmitic acid, C18:0: stearic acid, nd: not detected, RMSE: root means square error, M: mushroom, LDL: low-density-lipoprotein.
References
- Abou Fayssal, S., Alsanad, M. A., El Sebaaly, Z., Ismail, A. I. H., & Sassine, Y. N. (2020). Valorization of olive pruning residues through bioconversion into edible mushroom Pleurotus ostreatus (Jacq. Ex Fr.) P. Kumm. (1871) of improved nutritional value. Scientifica, 2020(3), 1–13. https://doi.org/https://doi.org/10.1155/2020/3950357
- Alborés, S., Pianzzola, M. J., Soubes, M., & Cerdeiras, M. P. (2006). Biodegradation of agroindustrial wastes by Pleurotus spp for its use as ruminant feed. Electronic Journal of Biotechnology, 9(3), 215–220. https://doi.org/https://doi.org/10.2225/vol9-issue3-fulltext-2
- Andrade, M. C. N., Zied, D. C., Minhoni, M. T. A., & Sansigolo, C. A. (2010). Análise química da madeira e casca de diferentes tipos de eucalipto antes e durante o cultivo de shiitake em toras. [Chemical analysis of wood and bark of different types of eucalyptus before and during the cultivation of shiitake in logs]. Árvore, 34(1), 165–175. https://doi.org/https://doi.org/10.1590/S0100-67622010000100018
- Association of Official Chemistry (AOAC). (1984). Official methods of analysis of the Association of Official Analytical Chemists (14th ed.). AOAC.
- Association of Official Chemistry (AOAC). (1990). Official methods of analysis of the Association of Official Analytical Chemists (15th ed.). AOAC.
- Association of Official Chemistry (AOAC). (1995). Official methods of analysis of the Association of Official Analytical Chemists (16th ed.). AOAC.
- Association of Official Chemistry (AOAC). (2019). Method No. 973.15 for (NDF), No. 2002.0 for (ADF and ADL). In AOAC Ed., Official methods of analysis of the Association of Official Analytical Chemists (21st ed.).
- Blom Invest Bank. (2017). The Lebanese Coffee Market: A brewing success. https://blog.blominvestbank.com/wp-content/uploads/2017/10/The-Lebanese-Coffee-Market-A-Brewing-Success.pdf
- Campos-Vega, R., Loarca-Piña, G., Vergara-Castañeda, H. A., & Oomah, B. D. (2015). Spent coffee grounds: A review on current research and future prospects. Trends in Food Science & Technology, 45(1), 24–36. https://doi.org/https://doi.org/10.1016/j.tifs.2015.04.012
- Carrasco-Cabrera, C. P., Bell, T. L., & Kertesz, M. A. (2019). Caffeine metabolism during cultivation of oyster mushroom (Pleurotus ostreatus) with spent coffee grounds. Applied Microbiology and Biotechnology, 103(14), 5831–5841. https://doi.org/https://doi.org/10.1007/s00253-019-09883-z
- Chang, N. W., & Huang, P. C. (1998). Effects of the ratio of polyunsaturated and monounsaturated fatty acid to saturated fatty acid on rat plasma and liver lipid concentrations. Lipids, 33(5), 481–487. https://doi.org/https://doi.org/10.1007/s11745-998-0231-9
- Cheung, P. C. K. (2010). The nutritional and health benefits of mushrooms. Nutrition Bulletin, 35(4), 292–299. https://doi.org/https://doi.org/10.1111/j.1467-3010.2010.01859.x
- Cohen, L., Persky, Y., & Hadar, R. (2002). Biotechnological applications and potential of wood degrading mushrooms of the genus Pleurotus. Applied Microbiology and Biotechnology, 58(5), 582–594. https://doi.org/https://doi.org/10.1007/s00253-002-0930-y
- Da Luz, J. M. R., Nunes, M. D., Paes, S. A., Torres, D. P., De da Silva, M. C. S., & Kasuya, M. C. M. (2012). Lignocellulolytic enzyme production of Pleurotus ostreatus growth in agro-industrial wastes. Brazilian Journal of Microbiology, 43(4), 1508–1515. https://doi.org/https://doi.org/10.1590/s1517-83822012000400035
- El Sebaaly, Z., Abou Fayssal, S., Shaban, N., & Sassine, Y. N. (2018a). Growing Agaricus bisporus on compost mixtures based on chicken manure and banana residues. Proceedings of the IX International Scientific Agriculture Symposium “Agrosym 2018” (pp. 1172–1180).
- El Sebaaly, Z., AlSanad, M. A., Hayek, P., Kfoury, L., Shaban, L., & Sassine, Y. N. (2018c). Using locally available chicken manure as a substitute to horse manure in compost formulas for growing Agaricus bisporus in Lebanon. Proceedings of the XXX International Horticultural Congress “IHC 2018” (pp. 337–344).
- El Sebaaly, Z., AlSanad, M. A., Semaan, H., Rizkallah, J., Shaban, N., & Sassine, Y. N. (2018b). Investigating the potential use of composted grape marc in the production of Agaricus bisporus. Proceedings of the XXX International Horticultural Congress “IHC 2018” (pp. 329–336).
- El Sebaaly, Z., Assadi, F., Sassine, Y. N., & Shaban, N. (2019). Substrate types effect on nutritional composition of button mushroom (Agaricus bisporus). Agriculture and Forestry, 65(1), 73–80. https://doi.org/https://doi.org/10.17707/AgricultForest.65.1.08
- Fan, L., Pandey, A., Mohan, R., & Soccol, C. R. (2000). Use of various coffee industry residues for the cultivation of Pleurotus ostreatus in solid-state fermentation. Acta Biotechnologica, 20(1), 41–52. https://doi.org/https://doi.org/10.1002/abio.370200108
- Fernández-Fueyo, E., Ruiz-Dueñas, F. J., López-Lucendo, M. F., Pérez-Boada, M., Rencoret, J., Gutiérrez, A., Pisabarro, A. G., Ramírez, L., & Martínez, A. T. (2016). A secretomic view of woody and nonwoody lignocellulose degradation by Pleurotus ostreatus.. Biotechnology for Biofuels, 9(49), 1–18. https://doi.org/http://doi.org/10.1186/s13068-016-0462-9
- Food and Agriculture Organization of the United Nations (FAO). (2010). Fats and fatty acids in human nutrition (Report of an expert consultation Food and Nutrition Paper No. 91). FAO.
- García, O., Bermúdez, S., Gaime, P., Rodríguez, P., Aguilera, R., & Morris, Q. (2011). Production of Pleurotus’s ligninolityc enzymes on coffee pulp by solid-state fermentation. Proceedings of the 7th International Conference on Mushroom Biology and Mushroom Products (pp. 144–149).
- Girmay, Z., Gorems, W., Birhanu, G., & Zewdie, S. (2016). Growth and yield performance of Pleurotus ostreatus (Jacq. Fr.) Kumm (oyster mushroom) on different substrates. AMB Express, 6(87), 1–7. https://doi.org/https://doi.org/10.1186/s13568-016-0265-1
- Hammond, J. B. W. (1980). The composition of fresh and stored oyster mushrooms (Pleurotus ostreatus). Phytochemistry, 19(12), 2565–2568. https://doi.org/https://doi.org/10.1016/S0031-9422(00)83919-9
- Khan, M. A., & Tania, M. (2012). Nutritional and medicinal importance of Pleurotus mushrooms: An overview. Food Reviews International, 28(3), 313–329. https://doi.org/https://doi.org/10.1080/87559129.2011.637267
- Koutrotsios, G., Danezis, G., Georgiou, C., & Zervakis, G. (2020). Elemental content in Pleurotus ostreatus and Cyclocybe cylindracea mushrooms: Correlations with concentrations in cultivation substrates and effects on the production process. Molecules, 25(9), 2179. https://doi.org/https://doi.org/10.3390/molecules25092179
- Labuschagne, P. M., Eiker, A., Aveling, T., De Meillon, S., & Smith, M. F. (2000). Influence of wheat cultivars on straw quality and P. ostreatus cultivation. Bioresource Technology, 71(1), 71–75. https://doi.org/https://doi.org/10.1016/S09608524(99)00047-4
- Murthy, P. S., & Naidu, M. M. (2012). Recovery of phenolic antioxidants and functional compounds from coffee industry by-products. Food and Bioprocess Technology, 5(3), 897–903. https://doi.org/https://doi.org/10.1007/s11947-010-0363-z
- Mussatto, S. I., Ballesteros, L. F., Martins, S., & Teixeira, J. A. (2012). Use of agro-industrial wastes in solid-state fermentation processes. In X. Guo & S. Kuan-Yeow (Eds.), Industrial waste (pp. 121–140). InTech Open Access Publisher.
- Naim, L., Alsanad, M. A., El Sebaaly, Z., Shaban, N., Abou Fayssal, S., & Sassine, Y. N. (2020a). Variation of Pleurotus ostreatus (Jacq. Ex Fr.) P. Kumm. (1871) performance subjected to differentdoses and timings of nano-urea. Saudi Journal of Biological Sciences, 27(6), 1573–1579. https://doi.org/https://doi.org/10.1016/j.sjbs.2020.03.019
- Naim, L., Alsanad, M. A., Shaban, N., El Sebaaly, Z., Abou Fayssal, S., & Sassine, Y. N. (2020b). Production and composition of Pleurotus ostreatus cultivated on Lithovit ® -Amino25 supplemented spent substrate. AMB Express, 10(188), 1–10. https://doi.org/https://doi.org/10.1186/s13568-020-01124-1
- Nieto, I. J., & Chegwin, C. A. (2013). The effect of different substrates on triterpenoids and fatty acids in fungi of the genus Pleurotus. Journal of the Chilean Chemical Society, 58(1), 1580–1583. https://doi.org/https://doi.org/10.4067/S0717-97072013000100017
- Patil, S. S., Ahmed, S. A., Telang, S. M., & Baig, M. M. V. (2010). The nutritional value of Pleurotus ostreatus (Jacq.: Fr.)Kumm cultivated on different lignocellulosic agrowastes. Innovative Romanian Food Biotechnology, 7, 66–76.
- Picornell-Buendía, M. R., Pardo-Giménez, A., & De Juan-Valero, J. A. (2016). Agronomic qualitative viability of spent pleurotus substrate and its mixture with wheat bran and a commercial supplement. Journal of Food Quality, 39(5), 533–544. https://doi.org/https://doi.org/10.1111/jfq.12216
- Reis, F. S., Barros, L., Martins, A., & Ferreira, I. C. F. R. (2012). Pleurotus spp. Chemical composition and nutritional value of the most widely appreciated cultivated mushrooms: An inter-species comparative study. Food and Chemical Toxicology, 50(2), 191–197. https://doi.org/https://doi.org/10.1016/j.fct.2011.10.056
- Ritota, M., & Manzi, P. (2019). Pleurotus spp. Cultivation on different agri-food by-products: Example of biotechnological application. Sustainability, 11(18), 5049. https://doi.org/https://doi.org/10.3390/su11185049
- Royse, D. J. (2014). A global perspective on the high five Agaricus, Pleurotus, Lentinula, Auricularia and Flammulina. Proceedings of the 8th International Conference on Mushroom Biology and Mushroom Products (ICMBMPS) (pp. 19–22).
- Sassine, Y. N., Abdel-Mawgoud, A. M. R., Ghora, Y., & Böhme, M. (2007). Effect of different mixtures with waste paper as casing soil on the growth and production of mushroom (Agaricus bisporus). Australian Journal of Basic and Applied Sciences, 1(2), 96–104.
- Shimelis, A. (2011). Optimization of coffee wastes for the cultivation of Pleurotus ostreatus [Unpublished master’s thesis]. Addis Ababa University.
- Stamets, P., & Chilton, J. S. (1983). The mushroom cultivator: A practical guide to growing mushrooms at home. Agarikon Press.
- Synytsya, A., Mícková, K., Jablonsky, I., Sluková, M., & Copíková, J. (2008). Mushrooms of genus Pleurotus as a source of dietary fibres and glucans for food supplements. Czech Journal of Food Sciences, 26(No. 6), 441–446. https://doi.org/https://doi.org/10.17221/1361-CJFS
- Tokimoto, T., Kawasaki, N., Nakamura, T., Akutagawa, J., & Tanada, S. (2005). Removal of lead ions in drinking water by coffee grounds as vegetable biomass. Journal of Colloid and Interface Science, 281(1), 56–61. https://doi.org/https://doi.org/10.1016/j.jcis.2004.08.083
- Tolera, K. D., & Abera, S. (2017). Nutritional quality of oyster mushroom (Pleurotus ostreatus) as affected by osmotic pretreatments and drying methods. Food Science & Nutrition, 5(5), 989–996. https://doi.org/https://doi.org/10.1002/fsn3.484
- Xiao, Q., Ma, F., Li, Y., Yu, H., Li, C., & Zhang, X. (2017). Differential proteomic profiles of Pleurotus ostreatus in response to lignocellulosic components provide insights into divergent adaptive mechanisms. Frontiers in Microbiology, 8, 480. https://doi.org/https://doi.org/10.3389/fmicb.2017.00480
- Zadrazil, F., Kamarad, D. N., Isikhuemhen, O. S., Shucharfdt, F., & Flachwosky, G. (1996). Bioconversion of lignocellulose into ruminant feed with white rot fungi - review of work done at FAL, Braunschweig. Journal of Applied Animal Research, 10(2), 105–124. https://doi.org/https://doi.org/10.1080/09712119.1996.9706139